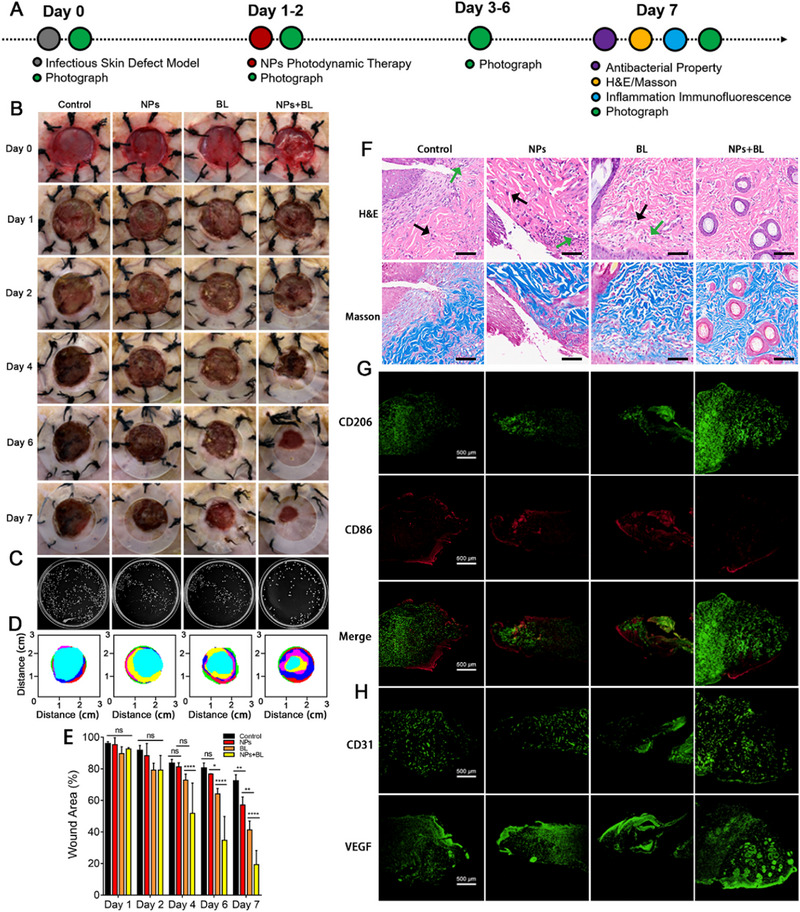
FIGURE 5.

Treatment efficiency of CCM+TTD@ZIF‐8 NPs combined with blue light in infected burn wounds. (A) Experimental schedule of infected burn wounds in SD rats. (B) Corresponding photos of wounds in all groups over the study period (day 0, 1, 2, 4, 6, and 7). (C) Bacterial colonies of wounds in the four groups on day 7. (D) Schematic diagram of wound trace in four groups after treatment for 7 days. (E) Quantification of wound area (%) over time (n = 3). (F) H&E and Masson staining of skin tissue in all groups on day 7, bar = 100 µm. (G,H) Immunofluorescence images of CD206, CD86, CD31, and VEGF. Statistical analysis for wound area was performed using one‐way ANOVA with Tukey's post hoc test. Data were displayed as mean ± SD. *p ≤ 0.05, **p ≤ 0.01, ***p ≤ 0.001. control: PBS, NPs: CCM+TTD@ZIF‐8 NPs, BL: blue light, VEGF: vascular endothelial growth factor.
