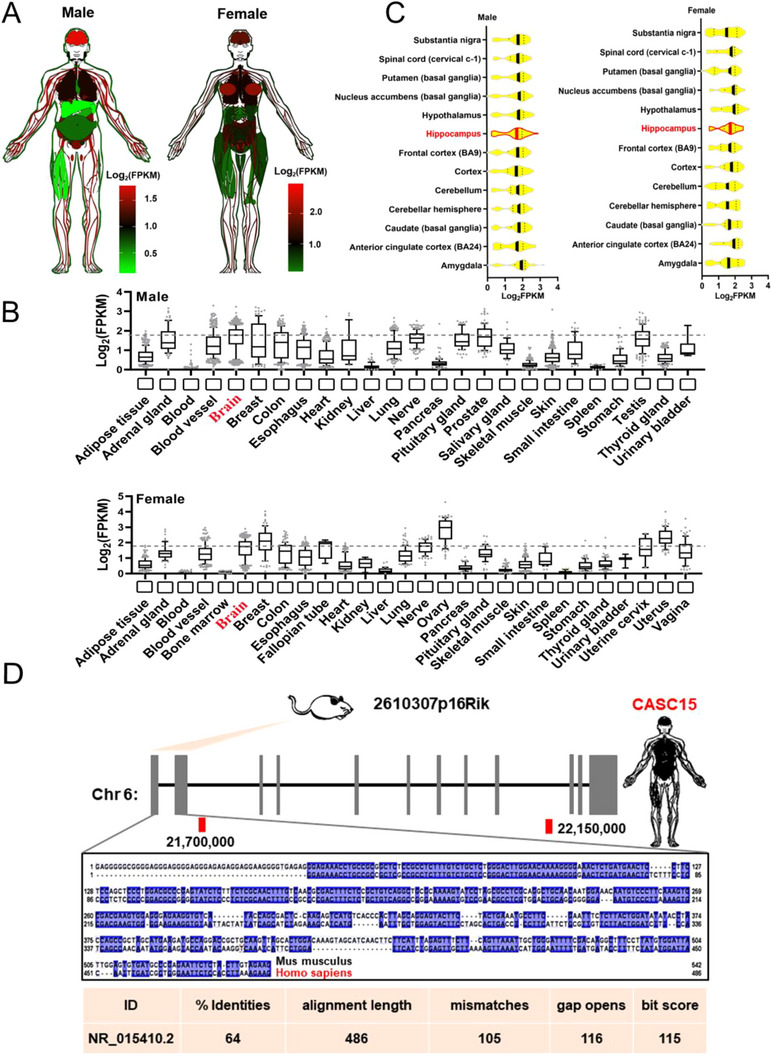
FIGURE 1.

CASC15 is highly expressed in hippocampal tissue. (A) Human body plot illustrating the expression of CASC15 in human tissues from the genotype‐tissue expression (GTEx) project; values shown are the Log2FPKM values by tissue. (B) Barplots showing expression of the CASC15 in human tissues from the GTEx project; brain expression is outlined in red. (C) Box plots showing expression of the CASC15 gene in human brain subregions from the GTEx project; hippocampus expression is outlined in red. (D) Schematic representation of alignment signatures found for mouse and the orthologous human CASC15 using slncky Evolution Browser; the conserved region between mouse and human is emphasized and the conserved sequences between mammals are underlined in blue. The conservation values of BLAST were summarized in the bottom table.
