FIGURE 2.

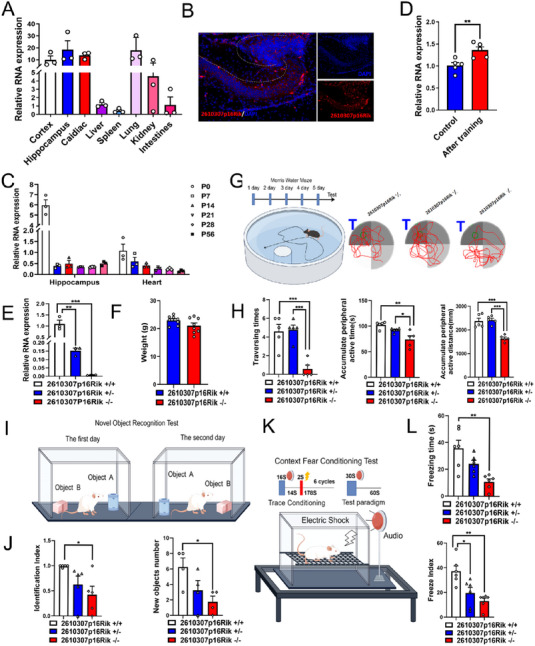
2610307p16Rik knockout mice have shown impairment in learning and memory functions. (A) Level of enrichment of 2610307p16Rik in various tissues and organs of mice was assessed by qRT‐PCR (U1snRNA was used as control), and data were normalized to the expression of liver (mean ± SEM, n = 3). (B) The expression of 2610307p16Rik in mouse hippocampus was detected by RNA‐FISH, scale bar: 10 µm. (C) The expression of 2610307p16Rik in the hippocampus and heart at different stages of nervous system development was measured by qRT‐PCR (U1snRNA was used as control), and data were normalized to the expression of P 0 heart (mean ± SEM, n = 3). (D) Relative expression levels of 2610307p16Rik before and after water maze training, and data were normalized to the expression of control group before water maze training (mean ± SEM, n = 5). Student′s t‐test **p < 0.01. (E) Relative expression levels of 2610307p16Rik in hippocampal tissues of 2610307p16Rik wild‐type, heterozygous, and knock‐out mice, and data were normalized to the expression of wild‐type group (mean ± SEM, n = 3). Student′s t‐test **p < 0.01, ***p < 0.001. (F) Body weight of 2610307p16Rik wild‐type and knock‐out mice (mean ± SEM, n = 8). (G) Model diagram of water maze and schematic diagram of space exploration experiment. (H) Number of platform crossing times, accumulate peripheral active time and distance in space exploration experiment of Morris water maze (mean ± SEM, n = 5). Student′s t‐test *p < 0.05, **p < 0.01, ***p < 0.001. (I) Model diagram of novel object recognition task. (J) Discriminate index, and exploring numbers on new objects of 2610307p16Rik wild‐type, heterozygous, and knock‐out mice in novel object recognition task (mean ± SEM, n = 5). Student′s t‐test *p < 0.05. (K) Model diagram of context fear conditioning test. (L) Freeze index, and freezing time of 2610307p16Rik wild‐type, heterozygous, and knock‐out mice in context fear conditioning test (mean ± SEM, n = 6). Student′s t‐test *p < 0.05, **p < 0.01.
