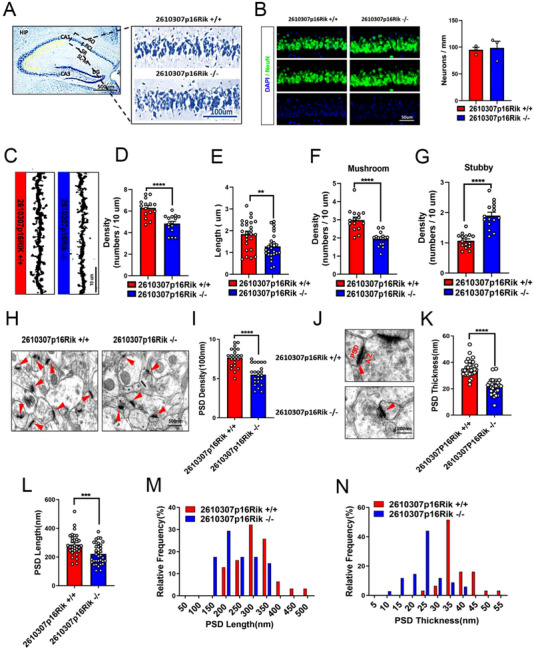
FIGURE 3.

Loss of 2610307p16Rik impairs synaptic plasticity in the CA1 region of hippocampal in mice. (A) Nissler staining was conducted to test the number of neurons in the CA1 region of 2610307p16Rik wild‐type and knock‐out mice hippocampus, scale bar: 100 µm. (B) NeuN positive cells in the CA1 region of 2610307p16Rik wild‐type and knock‐out mice hippocampus was detected by immunohistochemical staining. (C) Golgi staining analyses were used to observe the changes of neuronal dendritic spines in the CA1 region of 2610307p16Rik wild‐type and knock‐out mice hippocampus, scale bar: 10 µm. (D) Quantitative analysis of the density of neuronal dendritic spines in the CA1 region of hippocampal (mean ± SEM, 5 neurons/3 mice per group). Student′s t‐test ****p < 0.0001. (E) Quantitative analysis of the length of neuronal dendritic spines in the CA1 region of hippocampus (mean ± SEM, 5 neurons/3 mice per group). Student′s t‐test **p < 0.01. (F) Quantitative analysis of the number of mature Mushroom dendritic spines in the CA1 region of hippocampus (mean ± SEM, 5 neurons/3 mice per group). Student′s t‐test ****p < 0.0001. (G) Quantitative analysis of the number of mature Stubby dendritic spines in the CA1 region of hippocampus (mean ± SEM, 5 neurons/3 mice per group). Student′s t‐test ****p < 0.0001. (H) Transmission electron microscopy shows synaptic density changes of neurons in the CA1 region of the hippocampus of 2610307p16Rik knockout mice; the red triangle identifies the synapse, scale bar: 500 nm. (I) Quantitative analysis of the density of synapses in the CA1 region of the hippocampus (mean ± SEM, 7–8 neurons/3 mice per group). Student′s t‐test ****p < 0.0001. (J) Transmission electron microscopy was used to illustrate the synaptic thickness changes of neurons in the CA1 region of the hippocampus; the red triangle identifies the synapse, scale bar: 200 nm. (K) Quantitative analysis of the thickness of synapses in the CA1 region of the hippocampus (mean ± SEM, 10–11 neurons/3 mice per group). Student′s t‐test ****p < 0.0001. (L) Quantitative analysis of the length of synapses in the CA1 region of hippocampus (mean ± SEM, 10–11 neurons/3 mice per group). Student′s t‐test ****p < 0.0001. (M) The relative frequency of the length of synapses in the CA1 region of the hippocampus. (N) The relative frequency of the thickness of synapses in the CA1 region of the hippocampus.
