
FIGURE 2.
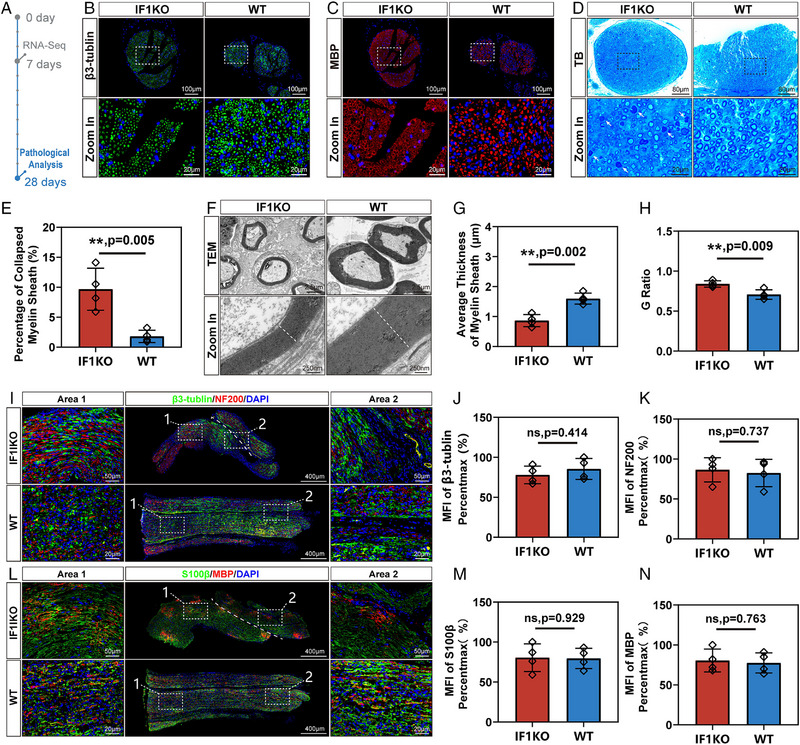
Pathological analysis of sciatic nerves 28 DPI in IF1KO and WT mice. (A) Illustration detailing the experimental timeline. (B) Transverse section showing immunofluorescent staining of crushed sciatic nerves (Green: β3‐tubulin, Blue: DAPI). (C) Transverse section displaying immunofluorescent staining of crushed sciatic nerves (Red: MBP, Blue: DAPI). (D) Transverse section presenting toluidine blue (TB) staining of crushed sciatic nerves. White arrows indicate collapsed myelin sheath. (E) Statistical analysis of the percentage of collapsed myelin sheath. (F) TEM images of crushed sciatic nerves. (G) Statistical analysis of the average thickness of the myelin sheath. (H) Statistical analysis of the G ratio. (I) Longitudinal section displaying immunofluorescent staining of crushed sciatic nerves (Green: β3‐tubulin, Red: NF200, Blue: DAPI). White dashed line indicates the discontinuous area. (J) Statistical analysis of the mean fluorescent intensity (MFI) of β3‐tubulin. (K) Statistical analysis of the MFI of NF200. (L) Longitudinal section exhibiting immunofluorescent staining of crushed sciatic nerves (Green: S100β, Red: MBP, Blue: DAPI). White dashed line indicates the discontinuous area. (m) Statistical analysis of the MFI of S100β. (N) Statistical analysis of the MFI of MBP. Statistical analysis for (E, G, H, J, K, M, N) was performed using unpaired two‐tailed Student's t‐test (n = 4). The data were normalized relative to the maximum reading within the entire dataset in (J, K, M, N).