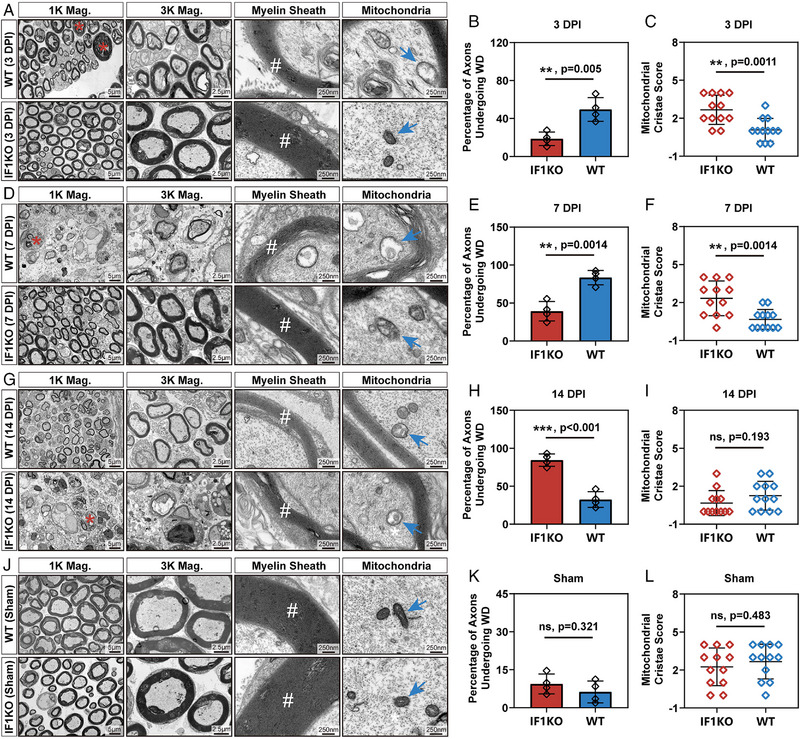
FIGURE 5.

Validation of the delayed Wallerian degeneration in IF1KO mice. (A, D, G, J) TEM images at various magnifications (Mag.) illustrating the ultrastructure of sciatic nerves at 3, 7, and 14 DPI and in the sham group. Red asterisks denote axons undergoing Wallerian degeneration, white hashtags indicate the myelin sheath structure, and blue arrows mark the mitochondria. (B, E, H, K) Statistical analysis of the percentage of axons undergoing Wallerian degeneration at 3, 7, and 14 DPI and in the sham group. (C, F, I, L) Statistical analysis of the mitochondrial cristae score at 3, 7, and 14 DPI and in the sham group. The statistical analysis for (B, C, E, F, H, I, K, L) was performed using an unpaired two‐tailed student's t‐test (n = 4). Of note, three reads from one biologically independent sample were included in the statistical analysis of mitochondria cristae score in (C, F, I, L). WD: Wallerian degeneration.
