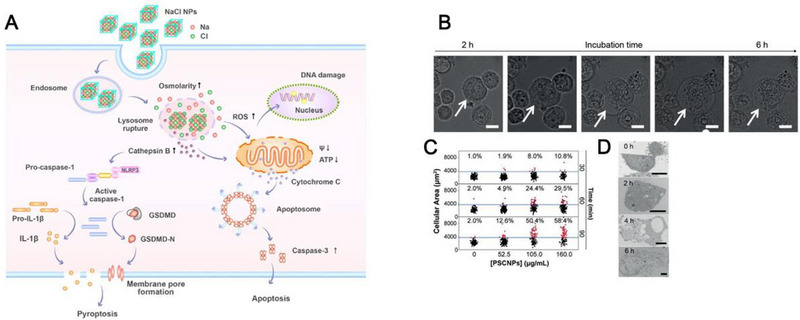
FIGURE 11.

(A) Schematic illustration of the mechanism of NaCl NP‐induced pyroptosis. (B) Cell morphology changes overtime with PSCNPs. Scale bar, 50 µm. (C) Cell volume changes based on the statistics of 5000 cells. (D) Representative TEM images of PSCNP‐treated PC‐3 cells. Scale bar, 5 µm. Reprinted with permission.[ 13 ] Copyright 2018, Wiley.
