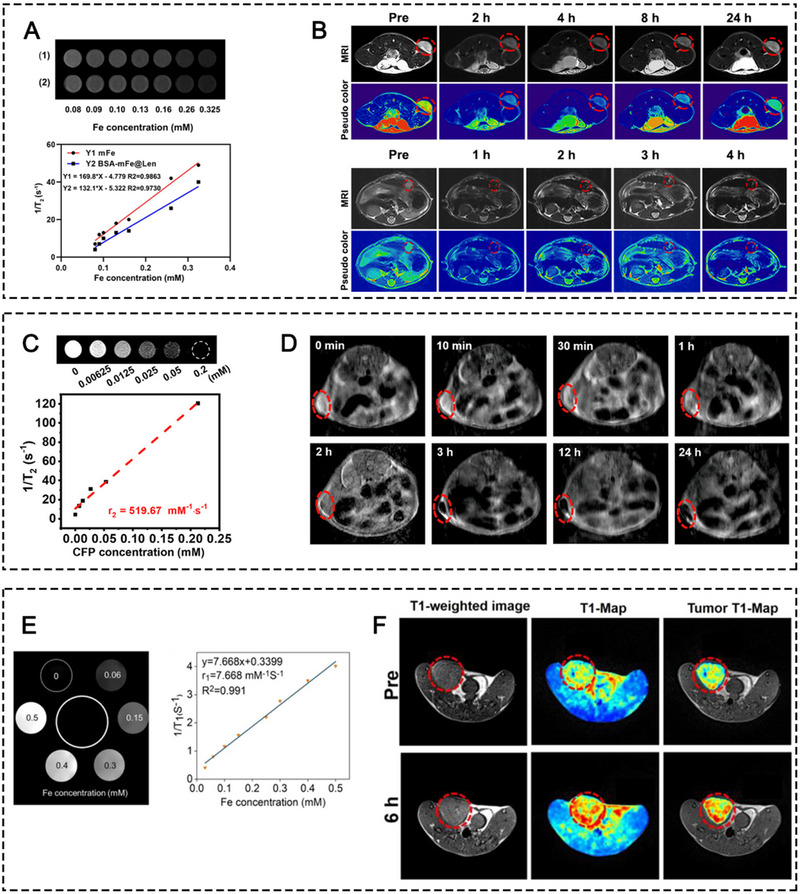
FIGURE 13.

(A) T 2‐weighted MRI phantom images and the counted r2 values of (1) the mFe and (2) BSA‐mFe@Len NPs with gradient Fe concentrations. (B) T 2 weighted grayscale MRI and pseudo color images of the subcutaneous and orthotopic tumor models after intravenous injection of BSA‐mFe@Len NPs. Reprinted with permission.[ 44c ] Copyright 2022, Elsevier. (C) T 2‐weighted MRI phantom images and the counted r 2 value of the CFP within gradient Fe concentrations. (D) T 2 weighted grayscale MRI of tumor regions at different time points after intravenous injection of CFP. Reprinted with permission.[ 47 ] Copyright 2022, American Chemical Society. (E) T 1‐weighted MRI phantom images and the counted r 1 value of the Fe‐PDA within gradient Fe concentrations. (F) T 1‐weighted MRI of tumor regions at different time points after intravenous injection of Fe‐PDA‐mPEG. Reprinted with permission.[ 44d ] Copyright 2022, American Chemical Society.
