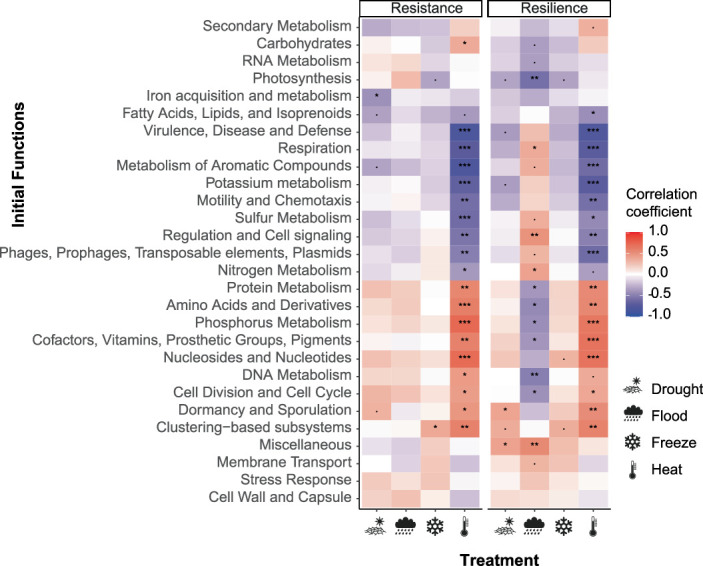
Extended Data Fig. 8. Correlations between soil initial functions and resistance and resilience of community function across samples from 28 different sites.

Rank correlations are shown between the initial relative abundance of each of the 28 highest level functions (from the metagenomics) and either the resistance (left) or resilience (right) of overall community function. Resistance and resilience are measured as the negative Bray-Curtis dissimilarity between control and disturbances treatment of the relative abundance of each of the finest scale functions (proteins) directly after the disturbance or after one month of recovery, respectively. Initial functions are clustered, with asterisks indicating a 2-tailed correlation test where the rank correlation is significantly different from zero (*** ≤ 0.001 <** ≤ 0.01 <* ≤ 0.05 <· ≤ 0.1, uncorrected for multiple testing).
