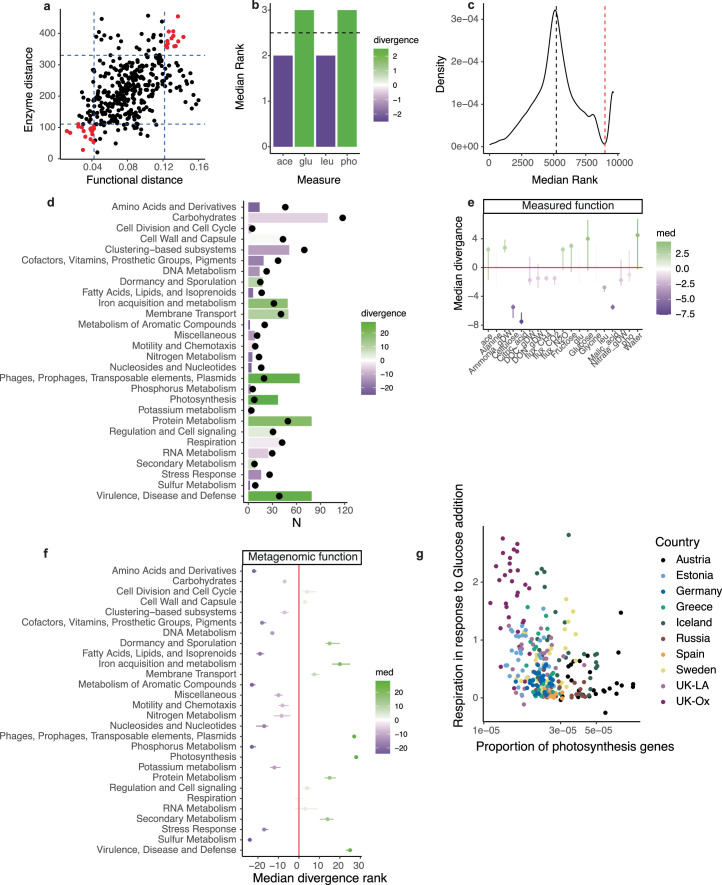
Extended Data Fig. 9. Drivers of correlations between metagenomic and measured functions in Fig. 4b.
Example is shown in a of the correlation between the distance matrix among samples for metagenome-derived functions and the distance matrix among samples of measured enzymatic activities for the freeze treatment at time point S4 (included in Fig. 4b). This is a rank correlation of 0.50, which is highly significantly different from zero (2-tailed Mantel test, N = 756 inter-site comparisons, Nperm=999 P ≤ 0.001). The blue dashed lines indicate the 10% and 90% quantiles of each distribution. The points falling beyond these lines on both axes (shown in red) correspond to comparisons between particular samples that are driving the correlation. Both for measured functions b (in this case four enzyme activities – ace = Acetate esterase enzyme activity; glu = Beta-glucosidase enzyme activity; leu = Leucine amino peptidase activity; pho = Phosphatase enzyme activity each originally in nmol/h/g dry soil) and the metagenomic functional data c (many, 10,408, individual proteins) we ranked the individual distances within each of these site comparisons and plotted the median rank across the selected site comparisons. In each case high ranks indicate large distances for comparisons from the upper right of part a and small distances for comparisons from the lower left of a. Thus a high median rank suggests that the variable is consistently important for determining the distance among samples in these extreme comparisons. In b we show with a dashed line the expected median rank if all measures behaved similarly and coloured by the divergence from this (ranking |(observed – expected)|/expected, then signed according to whether it the observed value is greater or less than expected). In c the distribution of median ranks has two main modes, one in the middle of the distribution, close to the null value (vertical black line), corresponding to measurements that are not consistently far or close between samples and therefore not driving the correlation, and one on the right, corresponding to comparisons that are consistently associated in the correlation-driving comparisons. We selected this second mode (taking all comparisons with a median rank above 9,000, indicated by the vertical red line) and looked at their corresponding highest-level functions in d. Here, the bars indicate the numbers of these high-ranking comparisons that involve proteins in the given functional category, whereas the black blobs indicate the numbers of proteins in that category that would have been expected, had there been a random selection. Colour then indicates the ranked divergence between these two, coloured by direction (as in b). There is under-representation of a wide range of smaller categories, such as Sulfur Metabolism and Metabolism of Aromatic compounds. We conducted these same analyses for all pairs of distances, all treatments and timepoints shown as a Mantel correlationin Fig. 4b, taking a median and interquartile range (point and error bars shown) across these correlations for measured functions e and metagenomic functions, f (N = 756 site-site comparisons in each case). Among laboratory functional measurements, none was particularly strongly associated with positive correlations, though specific substrate activities (citric acid, Cellulose and Malic acid) were consistently not driving the correlation. In contrast, the metagenomic functions, f, showed several high-level categories that were particularly over-represented in positive associations: Photosynthesis, Phages, Prophages, Transposable elements and Plasmids and Virulence, Disease and Defence; followed by Iron acquisition and metabolism, Dormancy and Sporulation, Protein Metabolism, Secondary metabolism. A more disparate range of metagenomic functions was un-associated with the measured functions. This suggests that particularly important relationships for driving the metagenomic association with measured functions may be those scoring highly in both e and f, such as g, the negative association between the proportion of photosynthetic genes and the response to glucose addition (N = 278 samples, rank correlation = −0.40, P = 3.8 × 10⁻¹²), each of which varies substantially across countries (colour).

