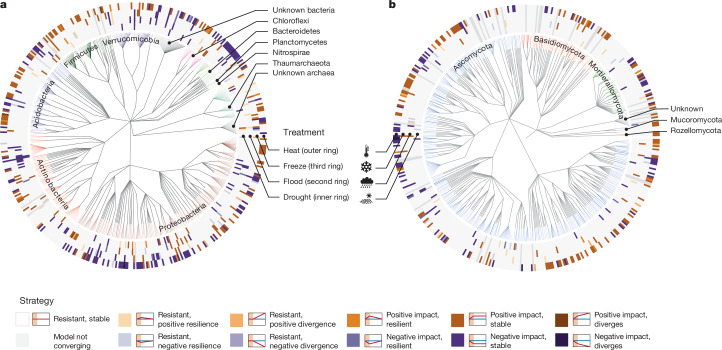
Fig. 2. Ecological resistance and resilience strategies associated with the 500 most abundant ASVs.
a,b, ASVs associated with prokaryotes (a) and fungi (b). The central tree indicates the taxonomy of the 500 most abundant ASVs, with tips coloured by phylum (more abundant ASVs are more intensely coloured). In the rings surrounding the tree (one per disturbance treatment), purple/blue colours indicate ASVs that perform significantly worse following disturbance (P ≤ 0.05, two-tailed Wald test, relative to other organisms and to the control treatment as fitted by a linear mixed-effects model across all soils, treatments and samplings, without correction for multiple testing; n = 548 and 586 samples for bacteria and fungi, respectively). Orange colours indicate ASVs that perform relatively better following disturbance using the same criteria. The shade of colour indicates the dynamics of the response as shown in the key: the darkest shades indicate a statistically significant divergence from the control at the end of the disturbance, followed by a statistically significant change in the same direction over the following month (that is, not resilient). The palest shades indicate no significant change at the end of the disturbance, but a significant divergence over the following month. ASVs in which a model did not converge are indicated by pale grey tiles across all four perturbation rings.

