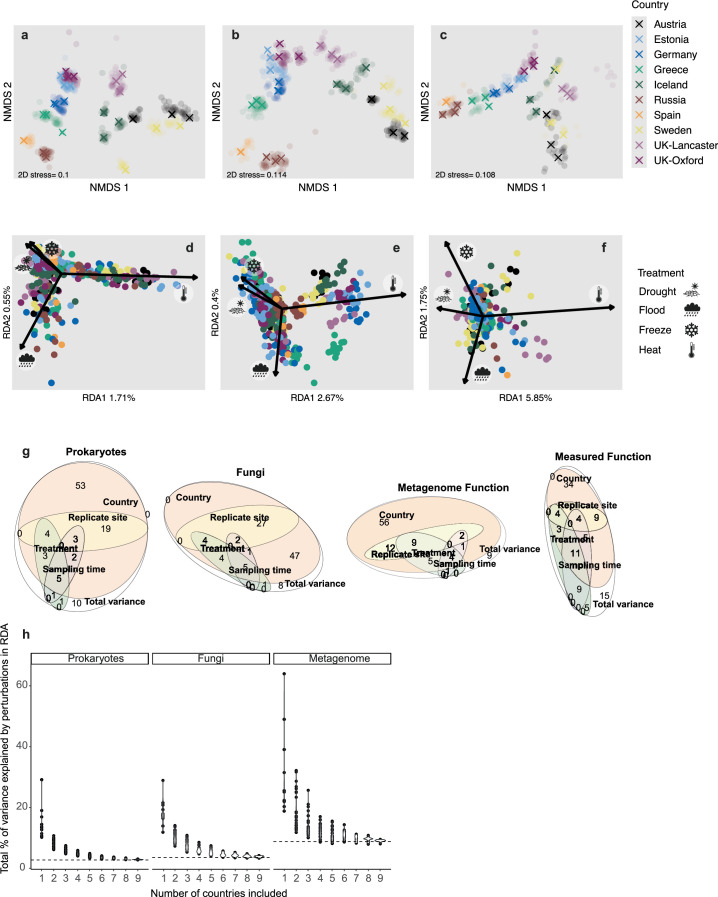
Extended Data Fig. 1. Alternatively coloured versions of the NMDS and RDA analyses in Fig. 1 and percentage variance explained.
Analyses are as in Fig. 1c–h, but in the NMDS analyses (a-c), initial samples are shown as crosses, with all other samples semi-transparent and in the RDA analyses (d-f) points are coloured by country (in the same way as in Fig. 1c–e). Euler diagrams (g) show the percentage of variance explained. Ellipses have areas approximately proportional to the variance explained by model terms that include the effect in question – Country (orange); Replicate site (yellow); Sampling time (pink) and Treatment (green). Overlaps of ellipses correspond to interactions among effects. The residual variance corresponds to the area only in the white, Total Variance, ellipse. Values annotated on particular areas are the percentage variance explained by that area to the nearest 1%. Thus, for example, the interaction among Country, Replicate site, and Treatment, represented by the overlap of orange, yellow and green ellipses, accounts for 4% of the variance in prokaryotes, fungi and measured functions, but 9% of variance in metagenomically inferred functions. Note that this representation is inevitably imperfect, specifically there are small ellipse overlaps that do not represent any variance; these are explicitly marked with a zero. Data from Extended Data Table 1. The variance in communities explained by the perturbations depends on the number of countries included (h). The total percentage community variance attributed to drought, flood, freeze and heat perturbations in the RDA analysis when repeated with fewer countries included in the data. The dashed line indicates the percentage variance explained by perturbations when including all ten countries (Fig. 1f–h). Points, summarised by an overlying ‘violin’ (indicating the density of points), correspond to the percentage variance for a reduced dataset missing all data from one or more of the countries. 30 randomly selected combinations of dropped countries were analysed for each size of dataset for Prokaryotes, Fungi and metagenomically encoded functions respectively.

