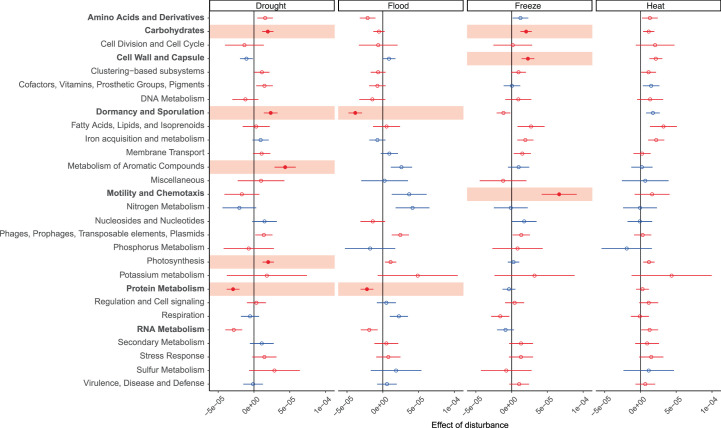
Extended Data Fig. 4. Resilience in the 28 highest-level functions in response to the extreme climatic events.
Analysis from the same models as Fig. 3a (N = 280 metagenomic samples, see Methods) and showing the same as that figure, except that values (points representing estimates from a mixed-effects model ±SE) indicate how the abundance of the function in question changes, relative to control, after a month of recovery (i.e. the interaction between treatment and time in a mixed-effects model). As in Fig. 3a,b, points are filled and contribute to the background colour if significantly different from the control by Dunnett’s test. However, the colour in each case here indicates resilience, i.e. if the change over time (relative to control) goes in the opposite direction to the initial disturbance (resilience), that is coloured red, whereas non-resilient functions, where change over time goes in the same direction as the initial change, are coloured blue.

