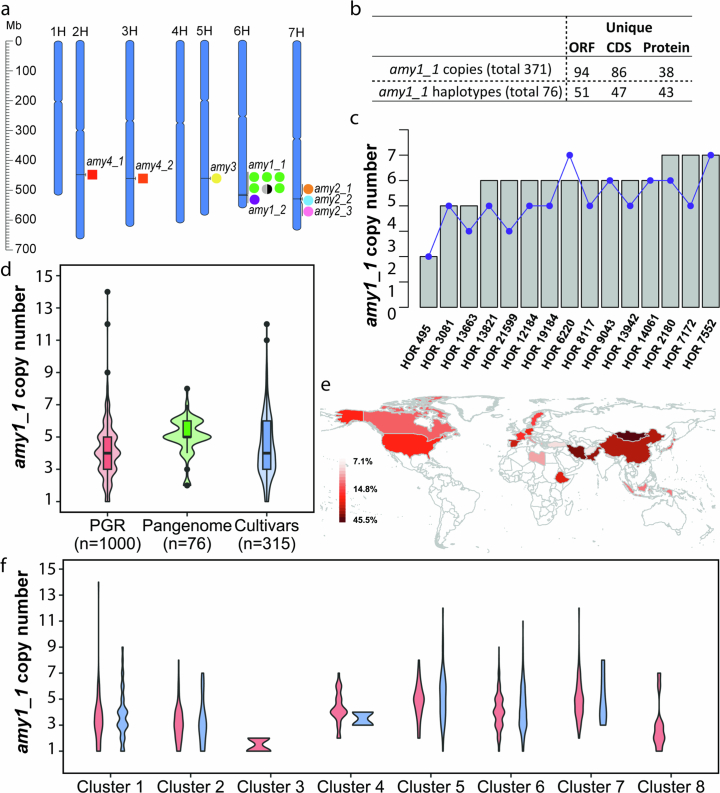
Extended Data Fig. 8. amy1_1 locus structure and copy number in 76 assemblies and 1,315 whole genome sequenced accessions.
(a) Chromosomal locations of 12 α-amylase genes in the MorexV3 genome assembly. (b) Summary of amy1_1 locus sequence diversity in the 76 pangenome assemblies (Supplementary Tables 14–19). The distribution of unique amy1_1 ORFs, CDS and protein copies and haplotypes (denoting combinations of amy1_1 copies in individual accessions) across the 76 pangenome assemblies. (c) Comparison of amy1_1 copy numbers identified in the pangenome assemblies versus k-mer based estimation from raw reads (Pearson correlation coefficient r = 0.69, two-sided p-value = 0.004). Grey bars denote copy number from pangenome, blue dots denote k-mer estimated copy number. (d) amy1_1 copy number estimation in 76 pangenome assemblies (“Pangenome”), 1,000 whole-genome sequenced plant genetic resources (“PGR”), and 315 whole-genome sequenced European elite cultivars (“Cultivars”) using k-mer based methods. The boxes delimit the 25th and 75th percentile, the horizontal line inside the box represents the median. Lower and upper whiskers denote minima and maxima. (e) Distribution of accessions with amy1_1 copy numbers >5 per country (as percentage of total accessions in country for countries with ≥10 accessions). (f) amy1_1 copy number within each haplotype cluster (see Extended Data Fig. 9b). Red color refers to 1,000 plant genetic resource accessions, green refers to 76 pangenome accessions and blue refers to 315 European elite cultivars in panels d and f. Clusters #5, #6 and #7 in panel f contain Barke, RGT Planet and Morex, respectively.

