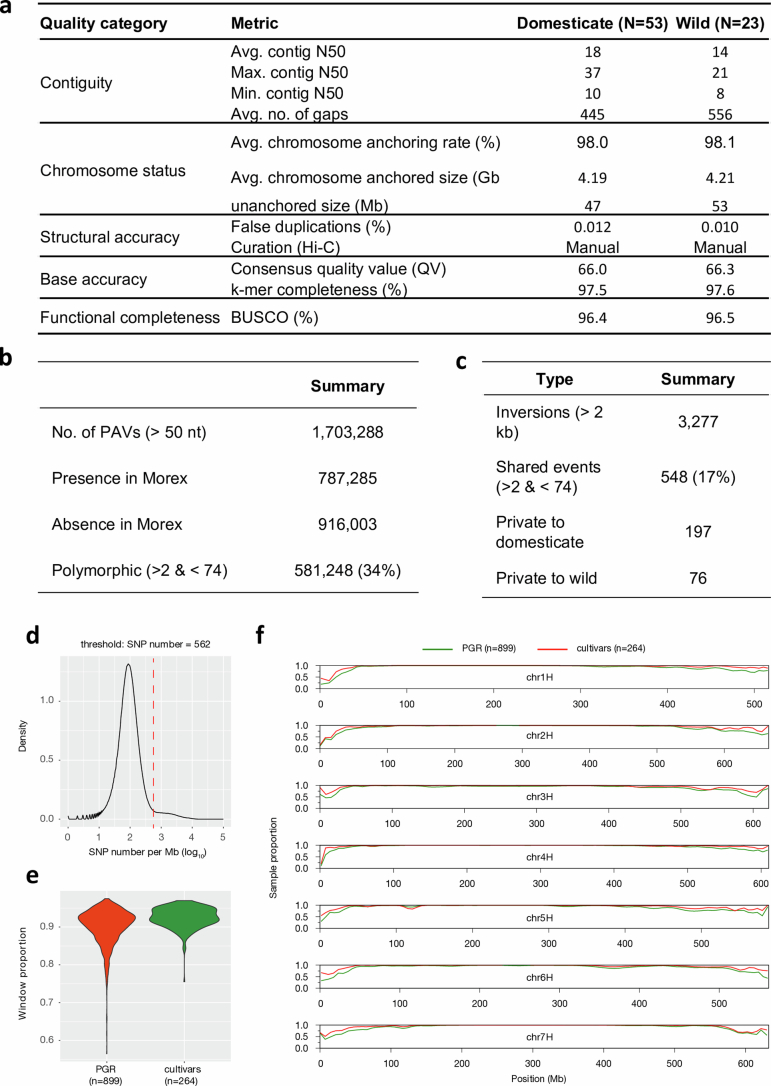
Extended Data Fig. 2. A pangenomic diversity map of barley.
(a) Assembly statistics of 76 chromosome-scale reference genome sequences. (b) Counts of presence/absence variants. (c) Counts of inversion polymorphisms spanning 2 kb or more. (d) Selection of threshold based on pairwise differences (number of SNPs per Mb) for the binary classification into similar/dissimilar haplotypes. (e) The proportion of samples with a close match to one of the 76 pangenome accessions is shown for plant genetic resources (PGR) and elite cultivars in sliding windows along the genome (size: 1 Mb, shift: 500 kb). (f) Distribution of the share of similar windows in individual PGR and cultivar genomes.

