FIGURE 2.

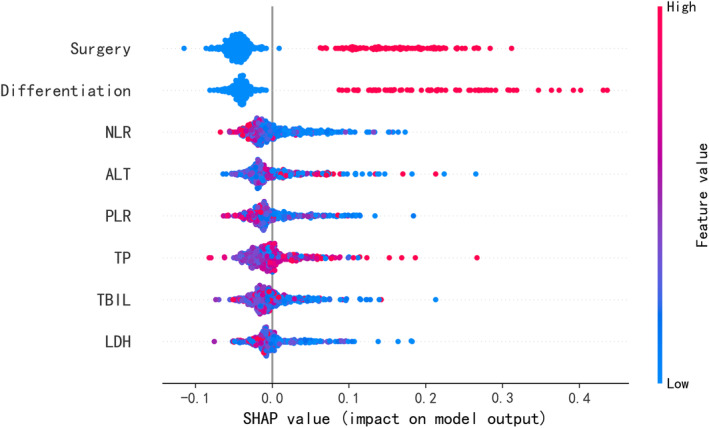
SHAP summary plot of the eight features of the Xgboost model. The higher the SHAP value of a feature, the higher the probability of complete response for chemotherapy.

SHAP summary plot of the eight features of the Xgboost model. The higher the SHAP value of a feature, the higher the probability of complete response for chemotherapy.