FIGURE 3.

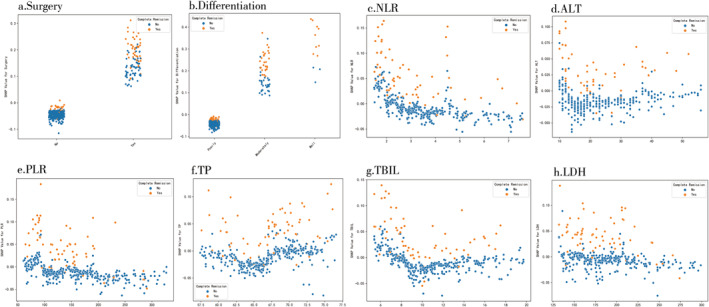
SHAP dependence plot of the Xgboost model. a. surgery; b. differentiation; c. NLR; d. ALT; e. PLR; f. TP; g. TBIL; h. LDH.

SHAP dependence plot of the Xgboost model. a. surgery; b. differentiation; c. NLR; d. ALT; e. PLR; f. TP; g. TBIL; h. LDH.