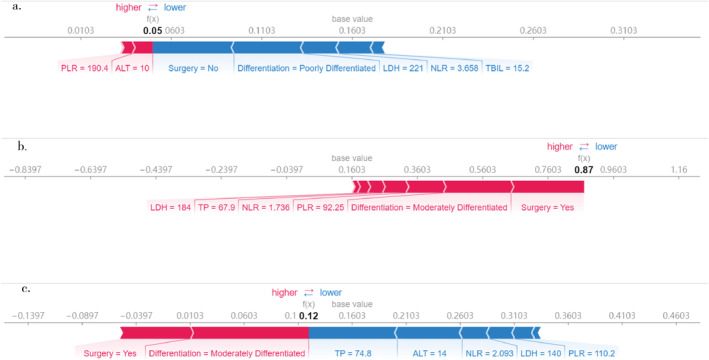
FIGURE 4.

Feature importance of three example individuals explained by SHAP. The model output value is the algorithm score for these three individual example patients. The red colors indicate that a feature pushed the output to a higher score, and blue colored features reduced the output score. a. false claim Patient #1, b. true claim Patient #2, c. false claim Patient #3.
