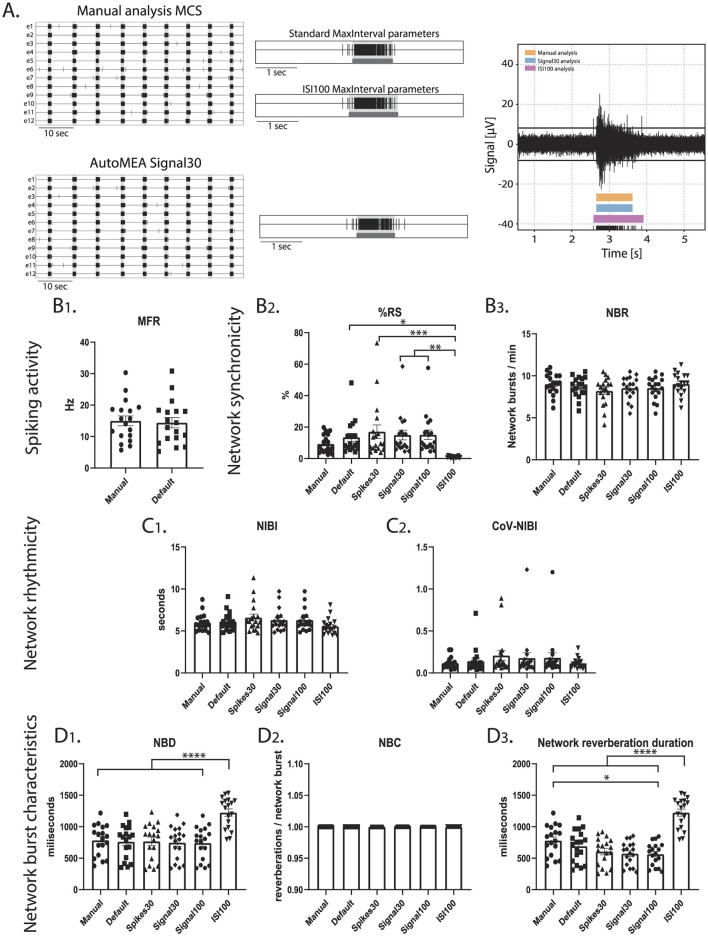
Figure 10.
Testing the performance of autoMEA burst detection on a cortical dataset. (A) Example raster plots with a 5-s section of a single electrode, analyzed using manual MCS analysis and the signal30 autoMEA model, and a raw data trace example of a single channel during a network burst for all genotypes at the bottom, black lines at the bottom represent spikes, orange bars (top) represent reverberations as detected with manual MCS analysis, the blue bars (middle) reverberations detected using the signal30 autoMEA models and the pink (bottom) the manual detection in MSC using ISI 100. (B) Comparison of the MFR, %RS, and NBR using all different burst detection methods. (C) Comparison of the NIBI and CoV-NIBI using all different burst detection methods. (D) Comparison of the NBD and NBC and network reverberation duration using all different burst detection methods. N = 18 wells. One way ANOVA: *p < 0.05, **p < 0.01, ***p < 0.001 ***p < 0.0001, ****p < 0.00001.

