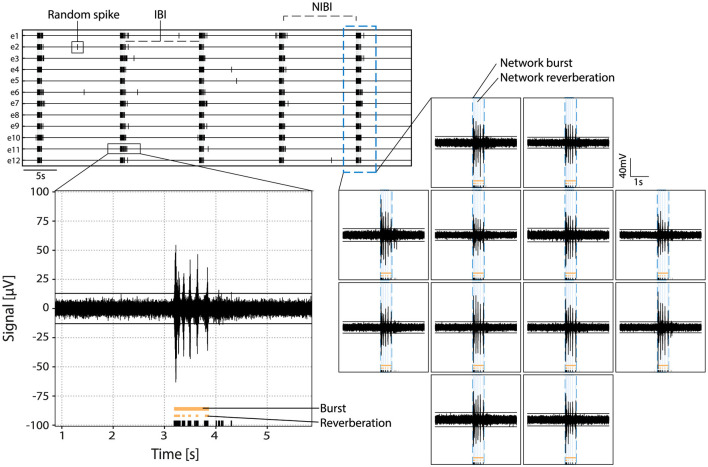
Figure 2.
Example of activity in primary hippocampal cultures. Top left: rasterplot with activity recorded on 12 electrodes with spikes indicated in black and network reverberations indicated with gray shading. Parameters random spike, bursts, and network bursts, IBI (inter-burst interval) and NIBI (network inter-burst interval) are indicated with boxes/lines in the raster. Bottom left: zoom in of the raw signal of a burst in one channel with spikes indicated in black, and reverberations and burst indicated in orange at the bottom. Right: raw signal of activity during a network burst. Bursts and reverberations detected on single channels are indicated in orange, overlaying light blue shade indicates detected network reverberations and the surrounding blue dotted line indicates the detected network burst.

