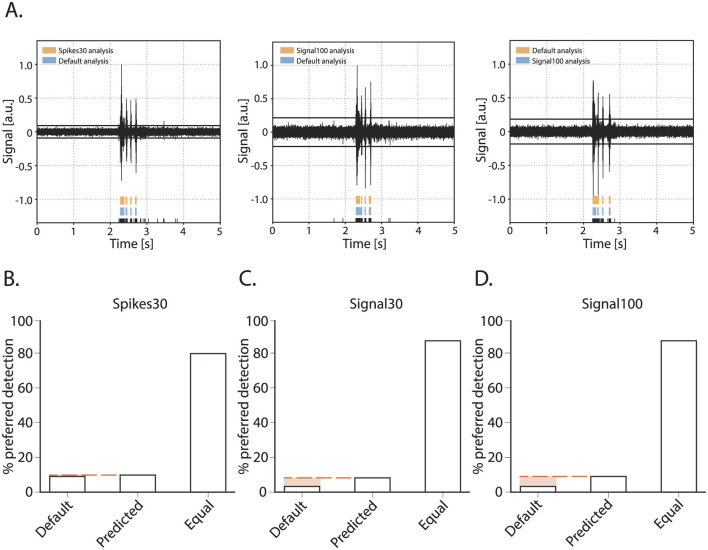
Figure 4.
Burst quality metric for the parameter prediction models. (A) Three examples of bursts as presented for scoring to an experimenter. Raw signal of a burst with detected spikes indicated in black at the bottom and above the reverberations as detected by either the default method or one of the detection models (spikes30, signal30, signal100). During scoring, the experimenter was blind to which color represented the default and spikes30/signal30/signal100 detection, and color could switch with each presentation of a new burst. E.g., (A) (left) default in blue, spikes30 in orange, (middle) default in blue, signal100 in orange, (right) default in orange, signal100 in blue. (B–D) Burst quality score with the % of bursts scored as preferred with default method, with a predicted model, or equal for each method.

