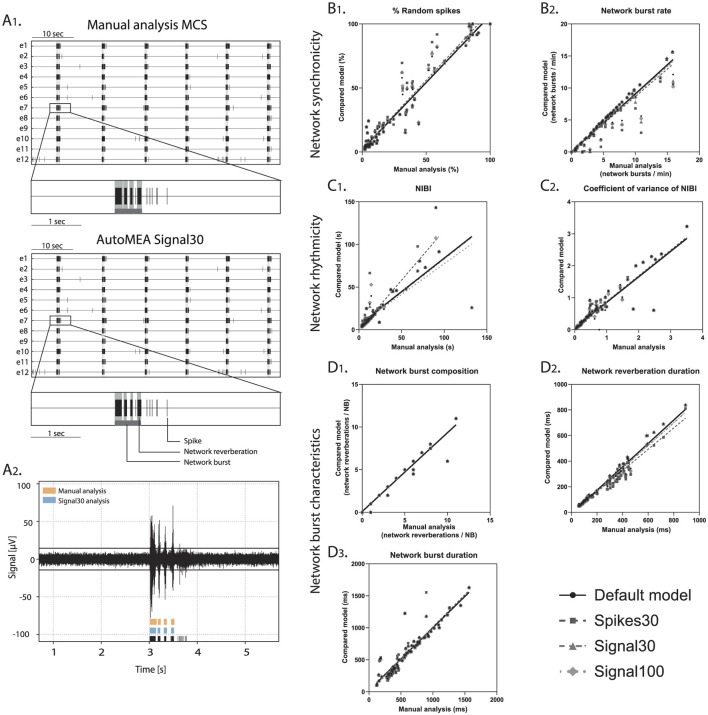
Figure 6.
Validation of accurate parameter detection by the autoMEA models: (A) 1. examples of raster plots and 5-s sections of a single electrode as detected by the Manual analysis in MCS (top) or signal30 autoMEA software (bottom). Black lines represent spikes, light gray bars overlaying raster plot represent reverberations, dark gray bar at the bottom of the zoom section represents the network burst. 2. raw data example of a single channel during a network burst with reverberation detection presented at the bottom of the graph by manual analysis MCS in orange (top) and signal30 autoMEA analysis in blue (middle) and spikes in black (bottom). (B) Correlation between outcome for network synchronicity 1. % random spikes, 2. Network burst rate. (C) Correlation between outcome parameters for network rhythmicity 1. Network inter burst interval (NIBI), 2. Coefficient of variance of NIBI. (D) Correlation between outcome parameters for network burst characteristics 1. network burst composition, 2. network reverberation duration, 3. network burst duration. N = 81 wells.

