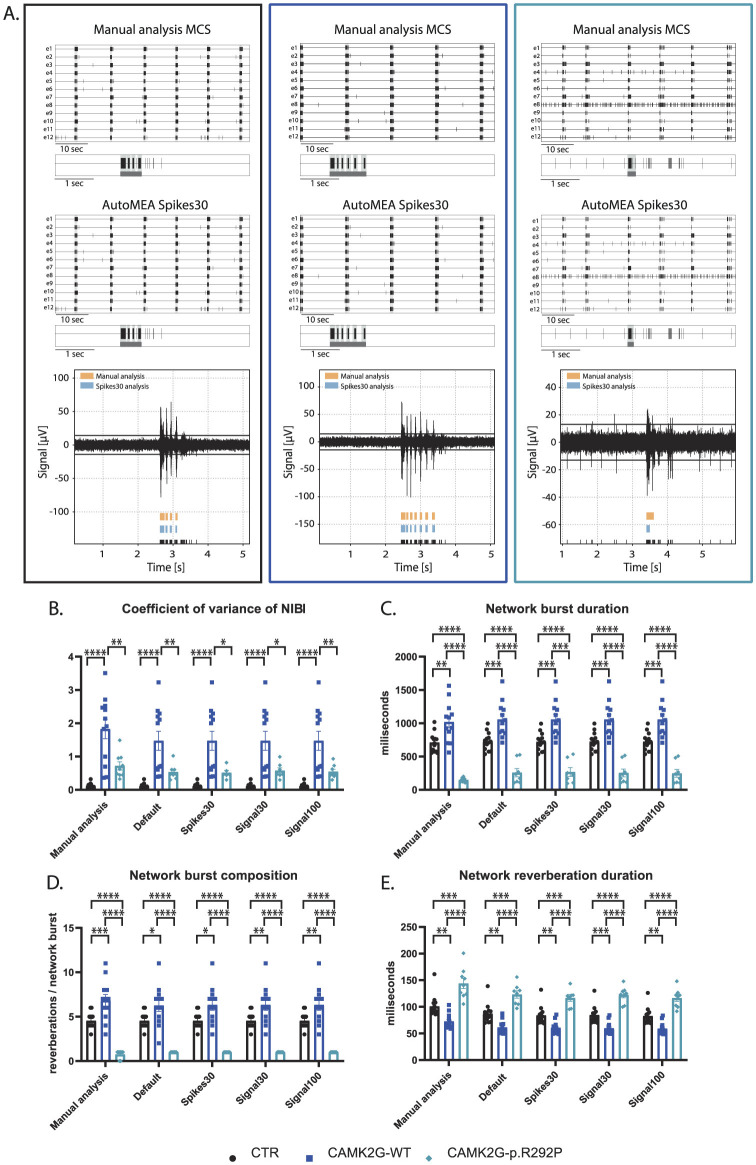
Figure 9.
Validation of the detection of phenotypes in a DIV18 set of the CAMK2G-p.R292P NDD model by the autoMEA software: (A) example raster plots with a 5-s section of a single electrode of control (black, left) and CAMK2G-WT (dark blue, middle), and CAMK2G-p.R292P (light blue, right) well from manual MCS analysis and the spikes30 autoMEA model, and a raw data trace example of a single channel during a network burst for all genotypes at the bottom, black lines at the bottom represent spikes, orange bars (top) represent reverberations as detected with manual MCS analysis and the blue bars (middle) reverberations detected using the spikes30 autoMEA model. (B) Comparison of the %RS for control, CAMK2G-WT, and CAMK2G-p.R292P cultures detected using all different burst detection methods. (C) Comparison of the network burst rate for control, CAMK2G-WT, and CAMK2G-p.R292P cultures detected using all different burst detection methods. (D) Comparison of the NIBI for control, CAMK2G-WT, and CAMK2G-p.R292P cultures detected using all different burst detection methods. (E) Comparison of the network burst duration for control, CAMK2G-WT, and CAMK2G-p.R292P cultures detected using all different burst detection methods. N(control) = 13 wells, N(CAMK2G-WT) = 12, N(CAMK2G-p.R292P) = 12. One way ANOVA: *p < 0.05, **p < 0.01, ***p < 0.001 ***p < 0.0001, ****p < 0.00001.

