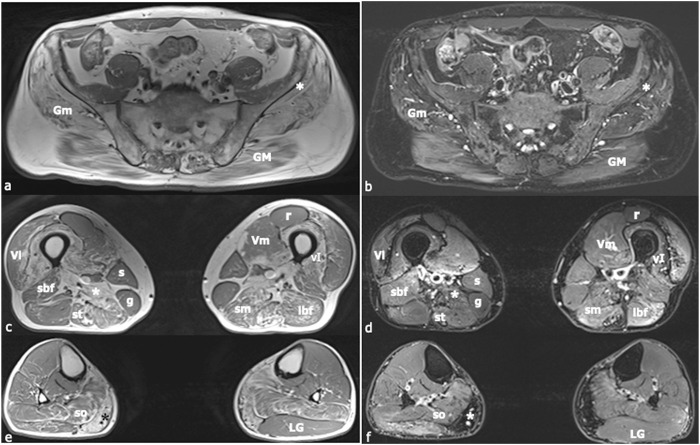
FIGURE 1.
Muscle Magnetic Resonance Imaging (MRI). In (A), (C), and (E) axial, T1-weighted images of the lower limbs are shown, whilst in (B), (D), and (F) axial T2-weighted images with fat-saturation are displayed. Images (A) and (B) were acquired at the level of the first sacral vertebra, images (C) and (D) at the midportion of the thigh, and images (E) and (F) at the proximal third of the leg. Increased T1-signal related to fibrous and fat infiltration was observed in the gluteus maximus (GM), gluteus medius (Gm), gluteus minimus [white asterisk in (A), (B)], semimebranosus (sm), semitendinosus (st), adductor magnus [white asterisk in (C), (D)], vastus intermedius (vI), medial gastrocnemius [black asterisk in (E), white asterisk in (F)], and soleus (so) muscles. A mild signal intensity increase in the T2-weighted sequence was found in the short head of the biceps femoris (sbf), long head of the biceps femoris (lbf), semimembranosus (sm), and semitendinosus (st) muscles, corresponding to muscle necrosis and consequent inflammatory response. The sartorius (s), gracilis (g), and lateral gastrocnemius (LG) muscles did not present any morphological changes. Muscle alteration pattern is consistent with the findings previously described in autosomal dominant calpainopathies. Vl = vastus lateralis; Vm = vastus medialis; r = rectus femoris.

