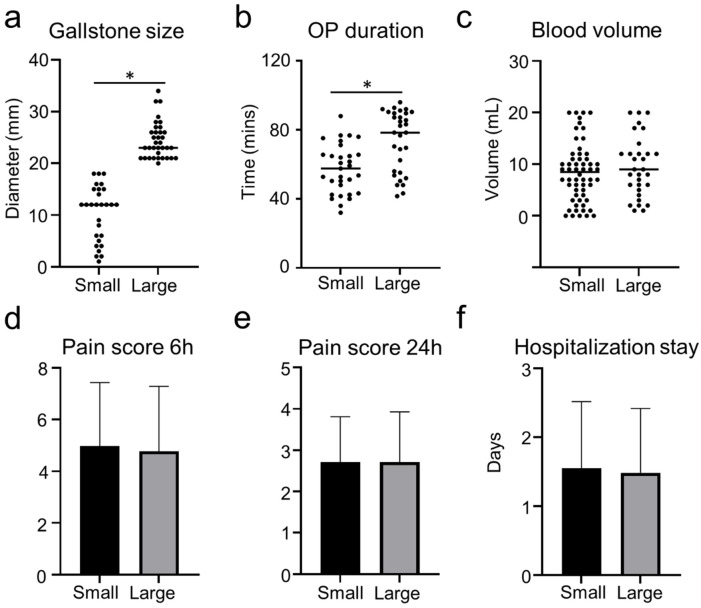
Figure 3.
Outcome of patients who were receiving SILC with small gallbladder or large gallbladder. (a) The plot chart shows the diameter of gallstones. (b) The plot chart shows the increased operation time of patients who receive SILC with small gallbladders compared with patients with large gallstones. (c) The plot chart shows no difference in the blood volume between the two groups. (d) The bar chart shows no difference in the pain score 6 h post-operation between the two groups. (e) The bar chart shows no difference in the pain score 24 h post-operation between the two groups. (f) The bar chart shows no difference in the hospitalization stays between the two groups. *:P < 0.05.

