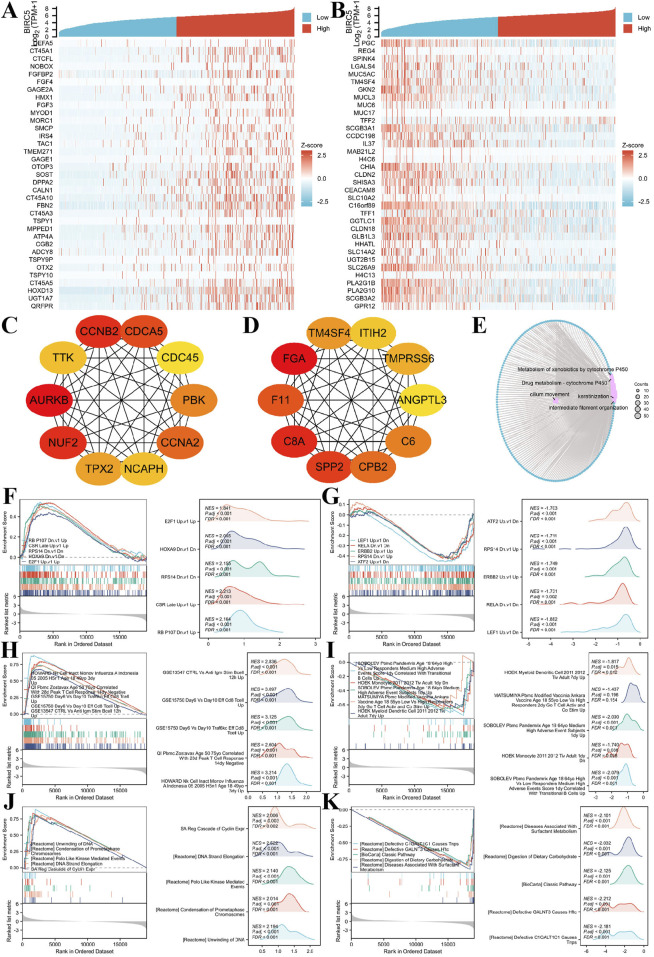
FIGURE 9.
BIRC5 differential expression in lung cancer and functional enrichment analysis. (A–B) Heatmaps of the top 30 genes positively and negatively correlated with BIRC5 in lung cancer; (C–D). HUB genes positively and negatively correlated with BIRC5; (E). Network diagram of GO/KEGG analysis of BIRC5 co-expressed genes; (F–G) Visualization of GSEA results for BIRC5 co-expressed genes (oncogenic); (H–I) GSEA visualization of BIRC5 co-expressed genes in immunologic signatures; (J–K) GSEA visualization of BIRC5 co-expressed genes in gene ontology.

