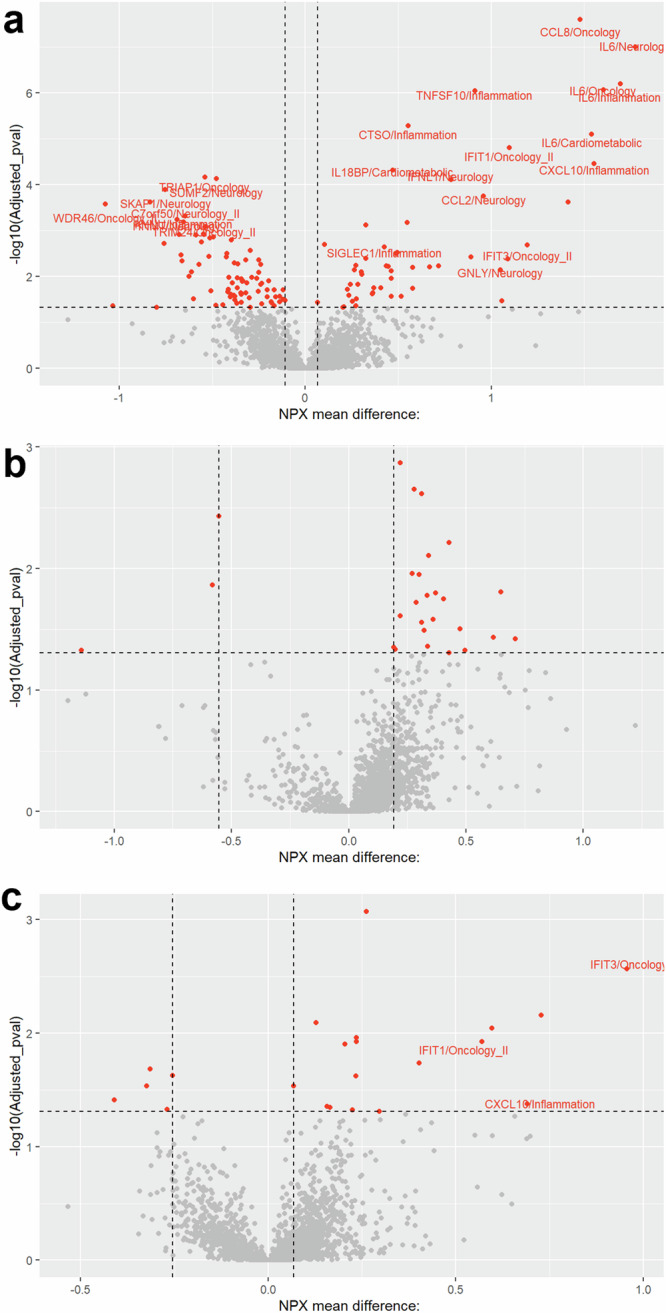
Fig. 2. Differences in protein levels between neonates with HSV infection and controls.

Volcano plots depicting protein differences in neonates with the neonatal HSV phenotypes compared with controls; a disseminated disease (n = 14), b CNS disease (n = 13), and c Skin-eye-mouth disease (n = 26). The x-axis represents the normalised protein expression (NPX) mean difference, and the y-axis represents the log10 p-value. The horizontal dashed line indicates the significance threshold (false discovery rate adjusted p-value < 0.05). The vertical dashed lines indicate the maximum (controls) and minimum (cases) NPX mean difference at significant false discovery rate adjusted p-values. The labelled proteins were significant in the post-hoc analyses when comparing individual HSV phenotypes with controls (n = 20 for disseminated disease, n = 3 for skin-eye-mouth disease).
