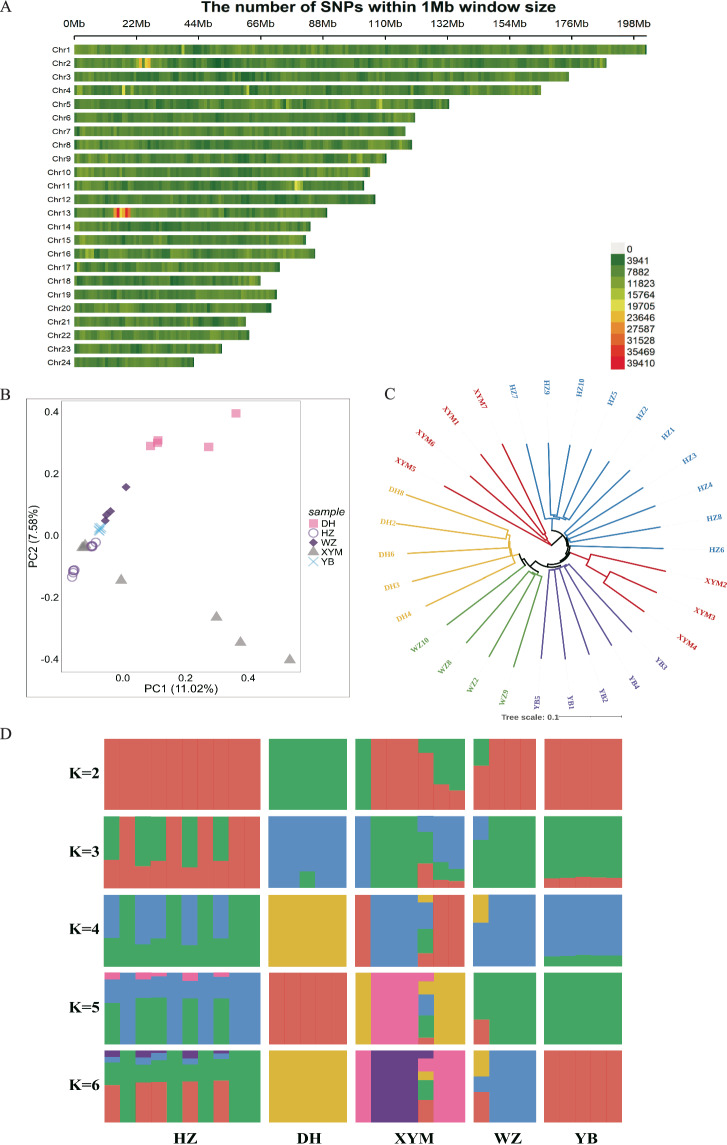
Fig. 2.
Population structure analysis based on whole genome sequencing data of five local buffaloes including Xuyi mountain (XYM, n = 7), Haizi (HZ, n = 10), Dehong (DH, n = 5), Wenzhou (WZ, n = 4) and Yibing (YB, n = 5) buffaloes. (A) Distribution map of whole-genome SNP marker density across chromosomes calculated using a 1 Mb sliding window. The color gradient from green to red indicates increasing SNP density in the respective regions. (B) Principal component analysis (PCA) of five local buffaloes. (C) Evolutionary tree of five local buffaloes based on genetic distance. (D) Ancestry compositions with the assumed number of ancestries at K value from 2 to 6. K is an adjustable parameter representing the number of possible ancestral varieties, where K = 2 is the best value after calculation of the cross-validation error.

