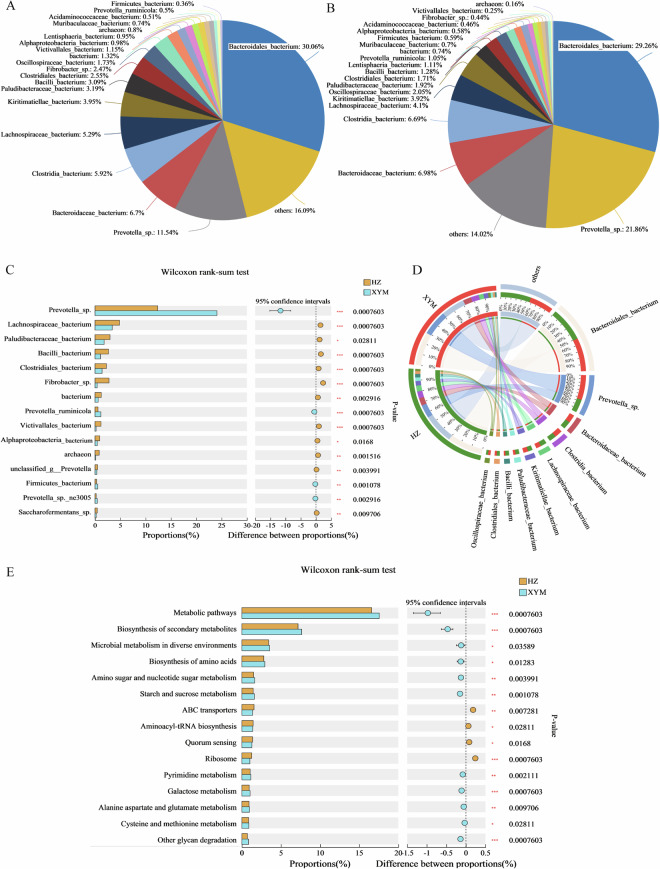
Fig. 4.
Comparative analysis of microbial composition and function at species level of Haizi (HZ) and Xuyi mountain (XYM) buffaloes. (A) The abundance percentages of HZ buffalo. (B) The abundance percentages of XYM buffalo. (C) The average relative abundance of the same species between HZ and XYM buffaloes. The vertical coordinate indicates the species under different classification levels. The horizontal coordinate indicates the abundance proportions of a certain species. Red asterisk indicates * of 0.01 < P-value ≤ 0.05, ** of 0.001 < P-value ≤ 0.01, *** of P-value ≤ 0.001. (D) Circos plots of species in relationship with HZ and XYM buffaloes. The abundance distribution of different species is connected through the inner color bands. The left semicircle (smaller circle) indicates the composition of species, while the right semicircle (larger circle) indicates the distribution of species. (E) Comparison of microbial functions based on the KEGG database at KEGG level 3. The vertical coordinate indicates the KEGG function names under different classification levels. The horizontal coordinate indicates the abundance proportions of a certain KEGG function.

