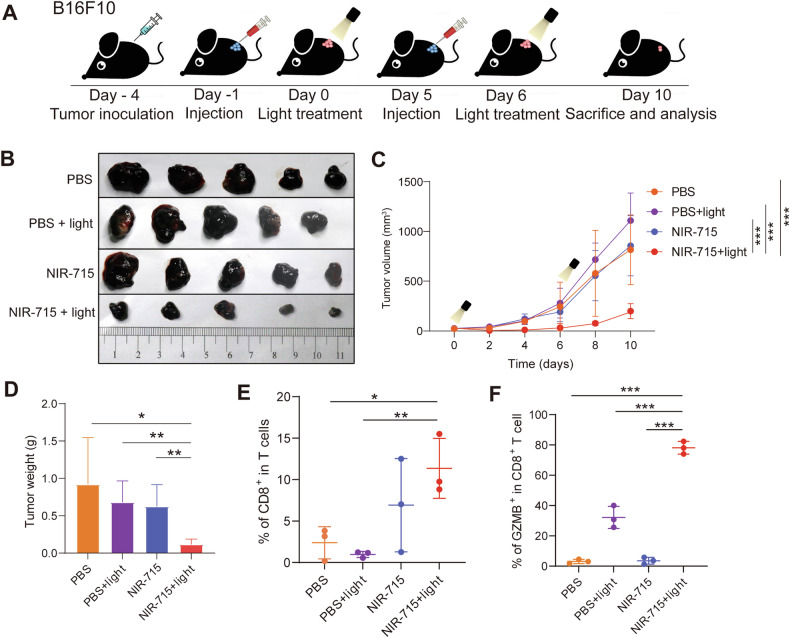
Fig. 7. In vivo validation of NIR-715 PDT efficacy in B16F10 tumors.
A Schematic illustration of the B16F10 tumor model experimental design. B Images of B16F10 tumors from tumor-bearing C57BL/6 mice on day 10 after performing NIR-715 PDT twice. C Tumor growth expressed as mean tumor volumes. Data are shown as mean ± SEM, n = 5. D Tumor weights of the four treatment groups. E, F Proportions of CD8+ T cells (E) and GZMB+ CD8+ T cells (F) in B16F10-bearing mice tumors were quantified by flow cytometry. Data represent mean ± SEM. *P < 0.05, **P < 0.01, ***P < 0.001.

