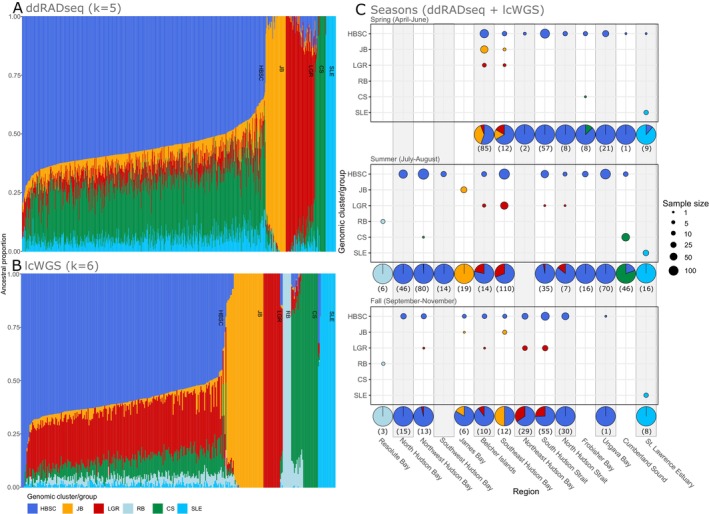
FIGURE 2.

Ancestral proportions obtained with ADMIXTURE for beluga whales from eastern Canada, 1989–2021. Panels A and B represent ADMIXTURE membership probabilities for the ddRADseq (without outlier loci) and the lcWGS datasets, respectively. Colors in panels A and B represent the clusters detected. For full results at K = 2–10 sorted by geographic location, see Figures S2–S4. Panel C characterizes temporal and regional variation in the proportion of individuals from each cluster identified by ADMIXTURE, combining results from both SNP datasets (the Population genomic analyses section in Methods describes how individuals with mixed ancestry were classified into clusters). Sample sizes are presented below each pie chart for each region and season. Since all winter samples (N = 8) were harvested in the Belcher Islands region, winter results are not shown in Panel C, but seven beluga whales were associated to the JB cluster and one to the HBSC cluster. Acronyms correspond to the following genomic clusters: CS = Cumberland Sound; HBSC = Hudson Bay‐Strait Complex; JB = James Bay; LGR = Little and Great Whale Rivers; RB = Resolute Bay; SLE = St. Lawrence Estuary.
