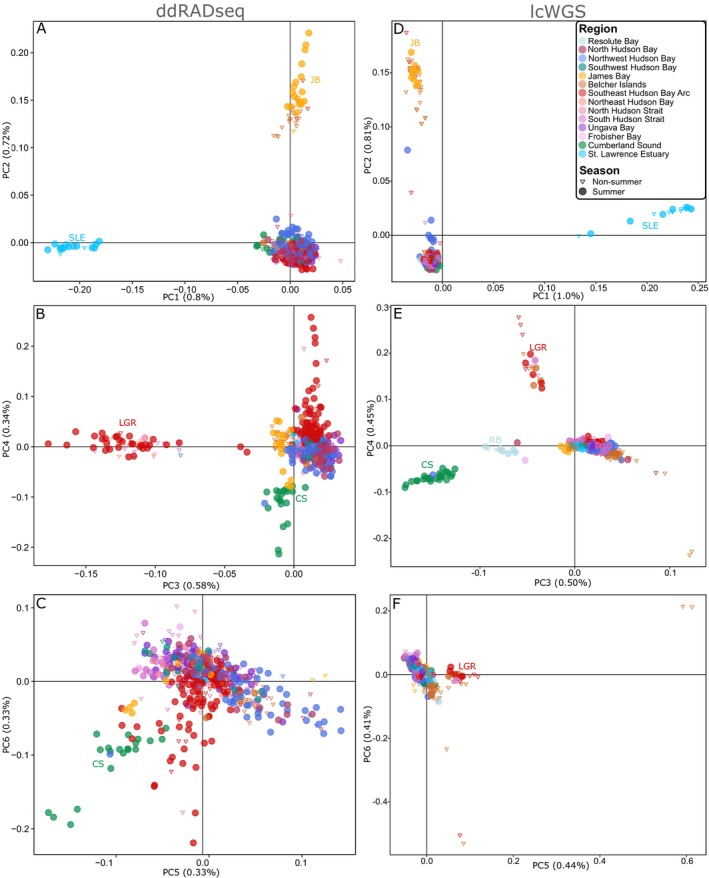
FIGURE 3.

Results from the Principal Component Analyses (PCA) of eastern Canada beluga whales using ddRADseq (without outlier loci; A, B, C) and lcWGS (D, E, F) datasets. Depicted are PC axes 1–2 (panels A, D), 3–4 (panels B, E), and 5–6 (panels C, F). Figure S6 presents percent variation explained by other PC axes. See Figure S5 for the comparison of ddRADseq PCA results with outlier loci. Colors represent sampling regions (Table 1), and acronyms correspond to the following genomic clusters: CS = Cumberland Sound; JB = James Bay; LGR = Little and Great Whale Rivers; RB = Resolute Bay; SLE = St. Lawrence Estuary.
