FIGURE 4.

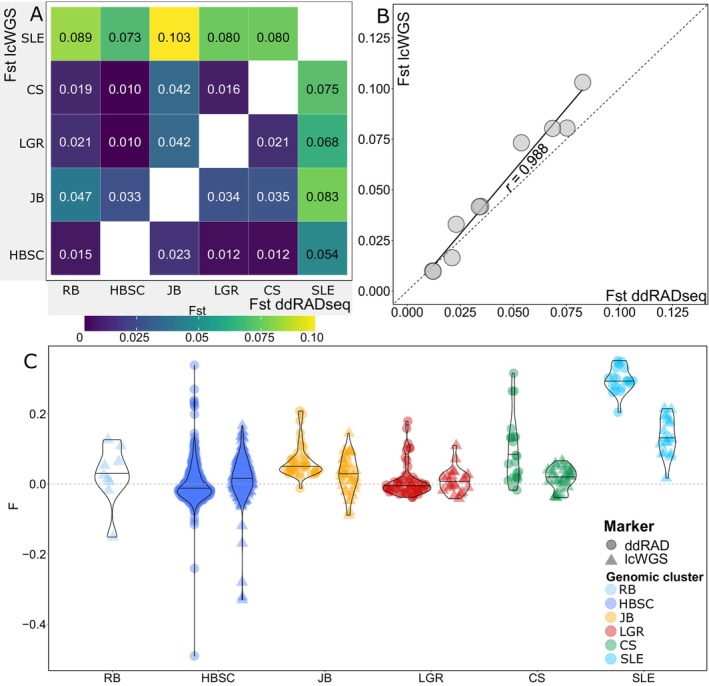
Population statistics for beluga whale genomic clusters in eastern Canada. (A) Heatmap of average F ST measurements for ddRADseq (without outlier loci) and lcWGS datasets. (B) Correlation of F ST estimates for genomic clusters identified with the ddRADseq (without outlier loci) and the lcWGS datasets. (C) Inbreeding coefficient (F) estimated with the ddRADseq (without outlier loci) and lcWGS datasets. Horizontal lines within violin distributions represent the median. Acronyms correspond to the following genomic clusters: CS = Cumberland Sound; HBSC = Hudson Bay‐Strait Complex; JB = James Bay; LGR = Little and Great Whale Rivers; RB = Resolute Bay; SLE = St. Lawrence Estuary. RB individuals were not genotyped with ddRADseq.
