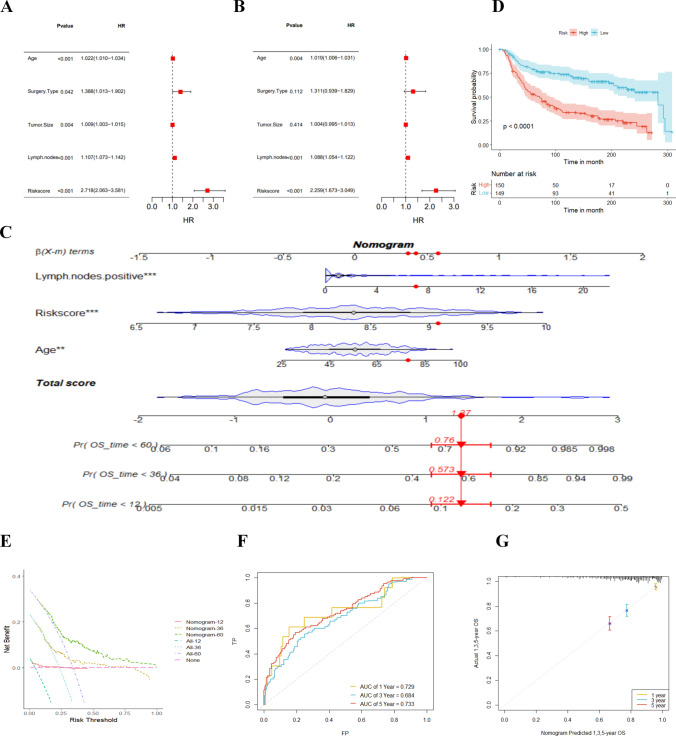
Fig. 5.
Prognostic impact of risk score and clinical characteristics of TNBC patients. A Univariate and (B) multivariate Cox analyses assessing prognosis and clinical characteristics including age, type of surgery, tumor size, lymph nodes, and risk score. C Column line plot of risk scores and clinical characteristics predicting 1-, 3-, and 5 year survival in the TCGA-TNBC cohort. D Kaplan-Meier survival curves based on column-line plots defining overall survival in high and low-risk patients with a validation set of the METABRIC cohort population. E Decision curve analysis, a specific method developed to assess the prognostic value of a column line plot strategy, where the column line plot with the greatest net benefit would be the most preferred model. F Survival ROC plots to determine the sensitivity and specificity of TNBC survival-related genes as indicators for determining survival. G Calibration curves of the TNBC risk factors nomogram. *p ≤ 0.5; **p ≤ 0.01; ***p ≤ 0.001; ****p ≤ 0.0001

