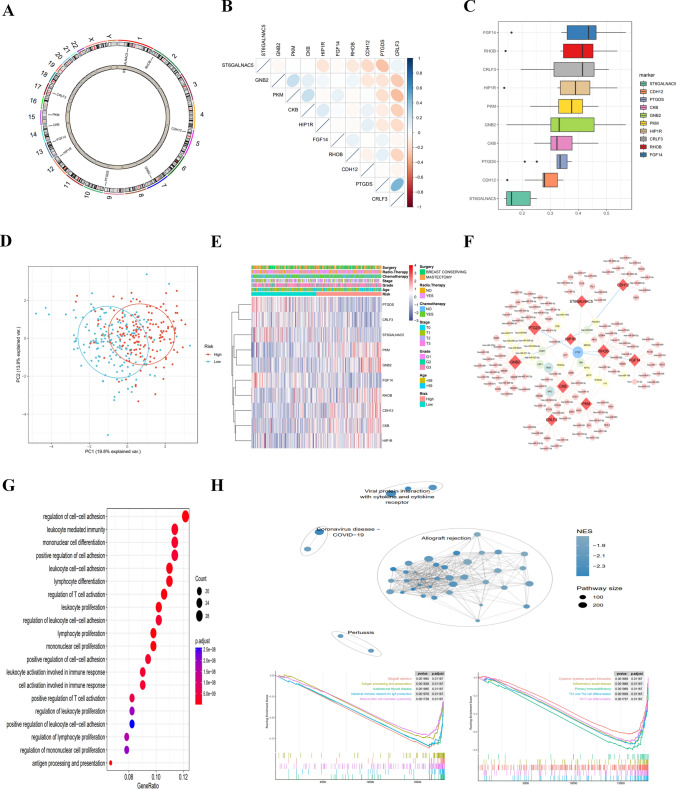
Fig. 7.
Transcriptional alterations and expression of MDD marker genes in TNBC disease and enrichment pathway analysis of risk genes. A Localization of CNV alterations on MDD marker genes on chromosome 23. B Correlation study of the expression of 10 MDD marker genes (C) Correlation visualization plot of 10 MDD marker genes in TNBC disease. D Principal component analysis showing significant differences between MDD marker high-risk and low-risk cohorts (E) Heatmap showing differences in clinical information and expression between MDD marker high-risk and low-risk cohorts (F) Regulatory network map of miRNA-transcription factors for 10 key genes. G Bubble diagram showing the results of KEGG enrichment analysis. H GSEA analyses of different KEGG pathways were clustered in the high-risk and low-risk groups. *p ≤ 0.5; **p ≤ 0.01; ***p ≤ 0.001; ****p ≤ 0.0001

