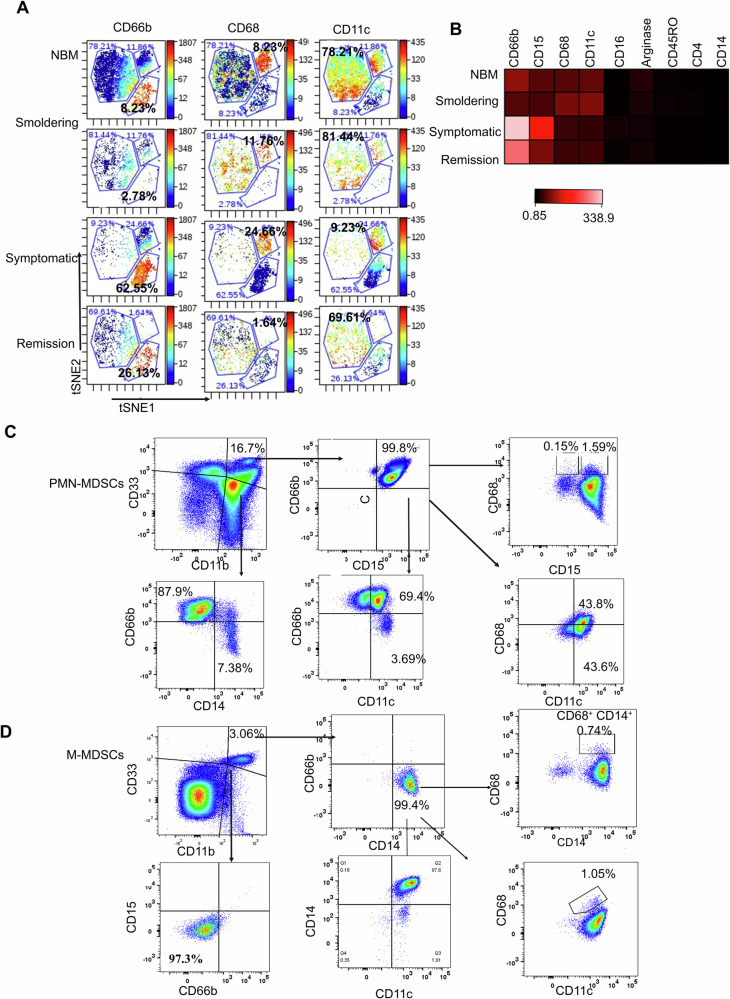
Fig. 2. Identification of PMN-MDSC subtypes in the WM bone marrow.
A t-SNE plots showing the expression of three subsets of MDSCs in NBM (n = 3), Smoldering (n = 3), symptomatic (n = 5), and Remission (n = 3), namely CD66b, CD68, and CD11c. B Heatmap showing the expression of CD66b, CD15, CD68, CD11c, CD16, Arginase, CD45RO and CD14. C CD66b+ cells sorted from the WM BM showing its PMN-MDSC phenotype expressing CD15 co-expression with CD66b. D CD66b- cells sorted from the WM BM showing its M-MDSC phenotype expressing CD14.

