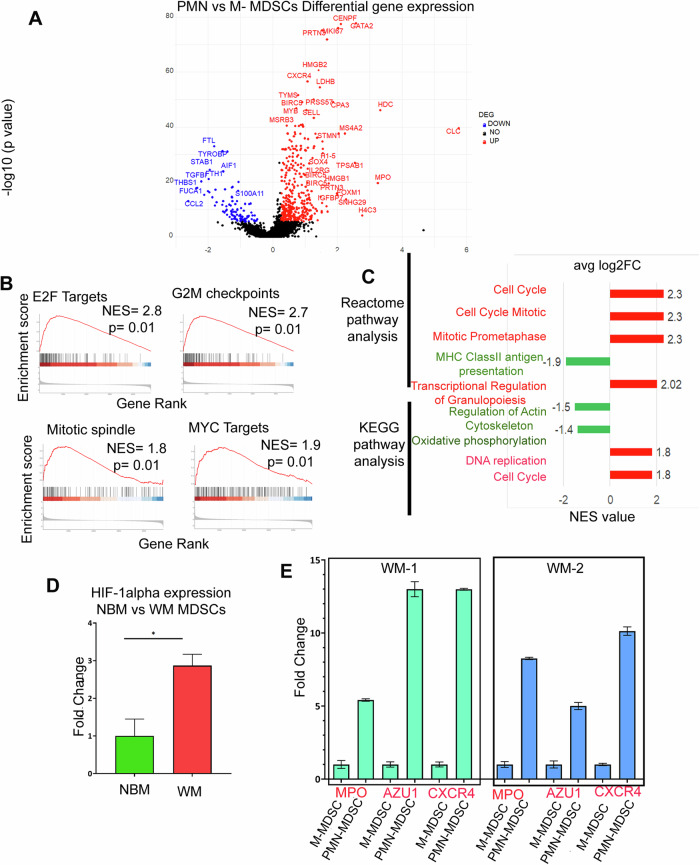
Fig. 4. Transcriptomic profile of PMN-MDSCs and M-MDSCs.
A Volcano plot of the transcriptome profile displaying the pattern of differentially expressed genes in PMN (CD11b+CD33+ HLADR-/low CD15+/CD66b+) vs M-MDSCs (CD11b+CD33+ HLADR-/low CD14+). Significantly expressed genes (log2 fold change ≥ 0.25, adjusted p ≥ 10e-6) are shown in the plot, where red and blue represents upregulated and downregulated genes respectively. B The enrichment score curve shows alteration of pathways involving E2F Targets, G2M checkpoints, Mitotic spindle, and MYC targets. The enrichment score normalized (NES) greater or less than zero shows upregulation and downregulation respectively. The plots were generated using Hallmark GSEA analysis. C Reactome and KEGG GSEA analysis showing significant pathways up and downregulated in PMN vs M-MDSCs. The red bar signifies highly upregulated pathways with high NES values and the green bars show low NES values with downregulated pathways. D qPCR analysis of H1F-α expression in WM vs NBM. E qPCR analysis of MPO, AZU1 and CXCR4 expression in PMN-MDSCs vs M-MDSCs.

