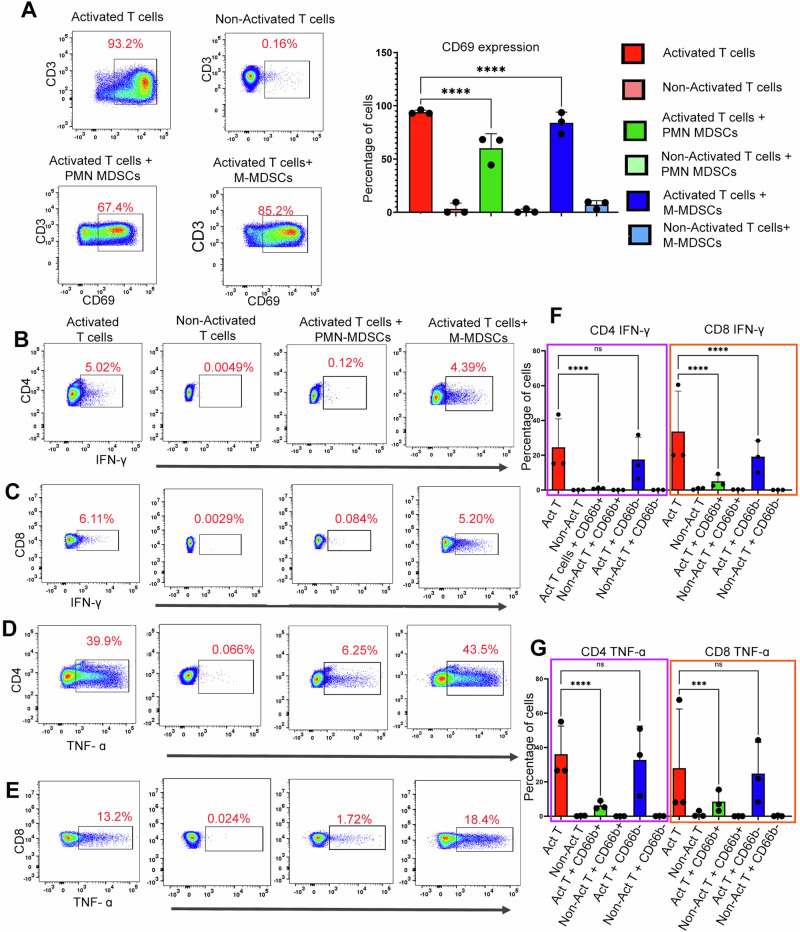
Fig. 5. PMN-MDSCs exhibit increased T-cell suppression.
The PMN and M-MDSCs were sorted by removing CD19 + CD138 + CD3+ cells first, then the negative fraction was sorted for CD66b. Here we considered the CD66b+ fraction as PMN-MDSCs and CD66b- cells as M-MDSCs. T-cells were isolated from the healthy donors. Also, the CD3/CD28 dynabeads were added to the culture for the activation of T-cells. In the experiment, activated and non-activated T cells were cultured alone for 24 h as controls. We observed a significant decrease in the viability of PMN-MDSCs between 24 and 48 h (n = 3). Thus, we used the 0-h time point as the control for the experiment. A The representative plot shows the suppressive effect of PMN-MDSCs when cultured with T-cells from healthy donors (1:1 ratio for 24 h). CD69 expression was calculated as the mean MFI which is shown on the bar graph. B Representative plots for INF-γ suppression on CD4 T-cells by PMN-MDSCs. The activated CD4-Tcells co-cultured with PMN-MDSCs showed higher suppression. C Representative plots showing the TNF-α cytokine expression in T-cells with the PMN-MDSCs and M-MDSCs coculture; paired t-test was used here, and MFI was plotted on the bar graph. D Representative plots showing the INF-γ expression by CD8 T-cells with the co-culture with PMN and M-MDSCs. E Representative plot showing TNF-α cytokine expression by CD8 T-cells when co-cultured with PMN and M-MDSCs. F Paired t-test for INF-γ was calculated, and MFI was plotted on the bar graph was plotted. G Paired t-test for TNF-α was calculated, and MFI was plotted on the bar graph was plotted.

