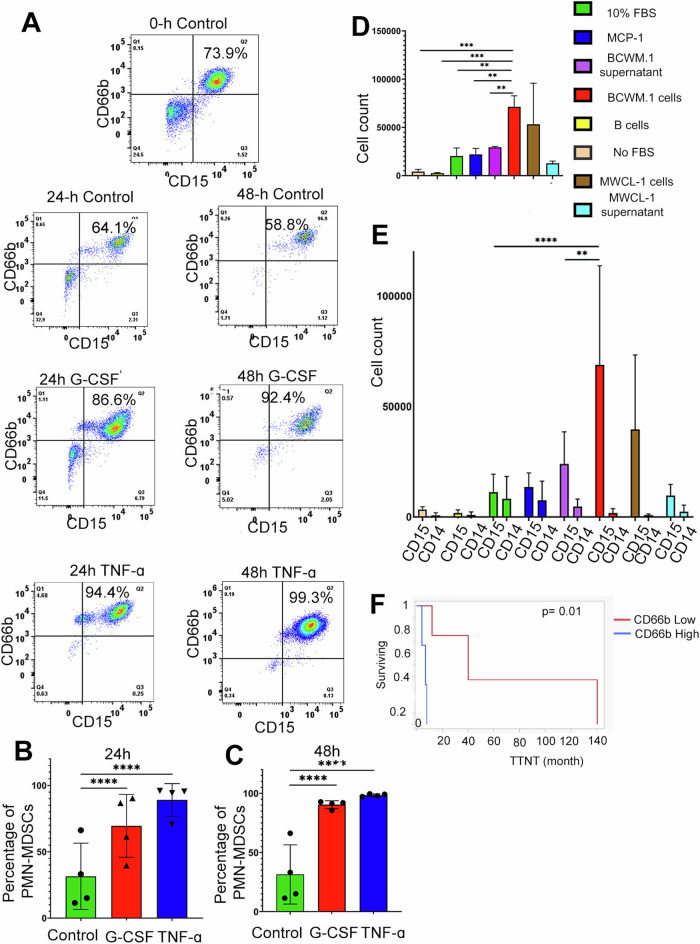
Fig. 6. PMN-MDSCs expand in response to cytokine stimulation and are attracted to malignant B-cells.
A PMN-MDSCs gated from the WM patient BM (CD19-CD138-CD3- CD56- HLADR-CD11b+ CD15+CD66b+). The cells isolated from the WM patient’s bone marrow at the time of processing was considered as 0 h control. (i) Representation plots showing PMN-MDSCs expansion in the presence of G-CSF (20 ng/ml) and TNF (10 ng/ml) and cultured for 24 h. (ii) Expansion was calculated (% of CD15+ CD66b+ cells) and was higher with PMN-MDSCs culture with G-CSF growth factor (B) Representation plots showing PMN-MDSCs expansion in 24 h of G-CSF and TNF culture with MDSCs from WM bone marrow. A significant expansion was observed with both the G-CSF growth factor and TNF cytokine. C Representation plots showing PMN-MDSCs expansion in 48 h of G-CSF and TNF culture with MDSCs from WM bone marrow. A significant expansion at 24 h and 48 h was observed with both the G-CSF growth factor and TNF cytokine. Expansion of MDSCs was calculated in a similar pattern with the number of CD15+ CD66b+ cells. D Transwell assay showing migration of MDSCs (CD11b+CD33+ cells) in the presence of BCWM.1 cells. (E) Transwell assay showing high migration of PMN-MDSCs in the presence of BCWM.1 cells. In the GCSF/TNF and migration analysis, paired t-test was calculated (n = 3 WM patients) and p ≤ 0.01, p ≤ 0.001, and p ≤ 0.0001 are represented by *, **, ***, and ****. F Comparison of overall time to next treatment (TTNT) in WM patients with high and low CD66b+ cells in the bone marrow [7 months (95% CI: 2.3–49 months) compared to 40 months (95% CI: 4.3–140 months) p = 0.01].

