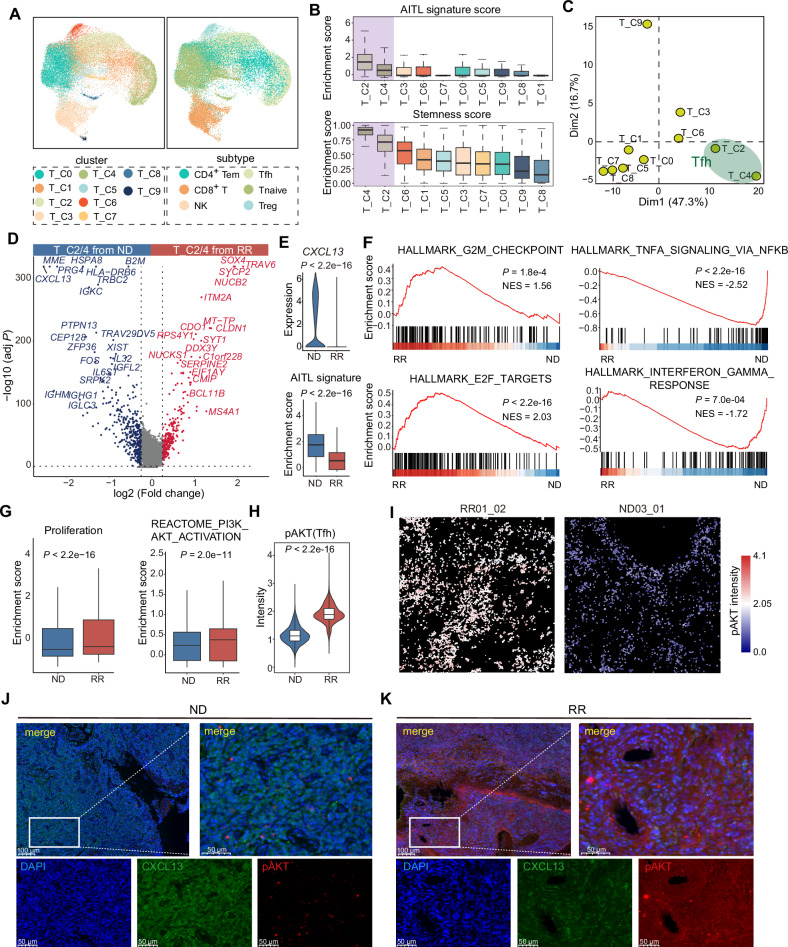
Fig. 2. Differences in the cellular states of malignant Tfh cells between ND-AITL and RR-AITL.
A UMAP visualization of various T/NK cell clusters (left) and subtypes (right). B Boxplot showing enrichment scores of AITL signature and stemness inferred by CytoTRACE across different T cells clusters. The boxplot represents the mean value and the error bar represents the standard error value. C Principal component analysis (PCA) of the clusters according to the mean transcription factor activity of each cluster. D Volcano plot of gene expression changes of Tfh cells between ND-AITL and RR-AITL. Upregulated (red) and downregulated (blue) genes in RR-AITL are highlighted. E Violin plot showing expression levels of CXCL13 in Tfh cells from ND-AITL and RR-AITL samples (upper panel). Violin plot showing enrichment score of AITL signatures in Tfh cells from ND-AITL and RR-AITL samples (bottom panel). P values were determined by two-sided unpaired Wilcoxon test. The boxplot represents the mean value and the error bar represents the standard error value. F GSEA plot showing the hallmarks that are significantly enriched in RR-AITL and ND-AITL, respectively. G Boxplot showing enrichment score of proliferation signature and PI3K/AKT pathway. P values were determined by two-sided unpaired Wilcoxon test. H Boxplot showing intensities of pAKT in IMC data. P values were determined by two-sided unpaired Wilcoxon test. I The IMC images showing the protein activity of pAKT within malignant Tfh cells. The colors represent protein activity levels, ranging from lower (blue) to higher (red). J, K Immunofluorescence analysis for ND-AITL and RR-AITL samples stained by an-ti-DAPI (blue), anti-CXCL13 (green), anti-pAKT (red) antibodies. Scale bar, 100 μm.

