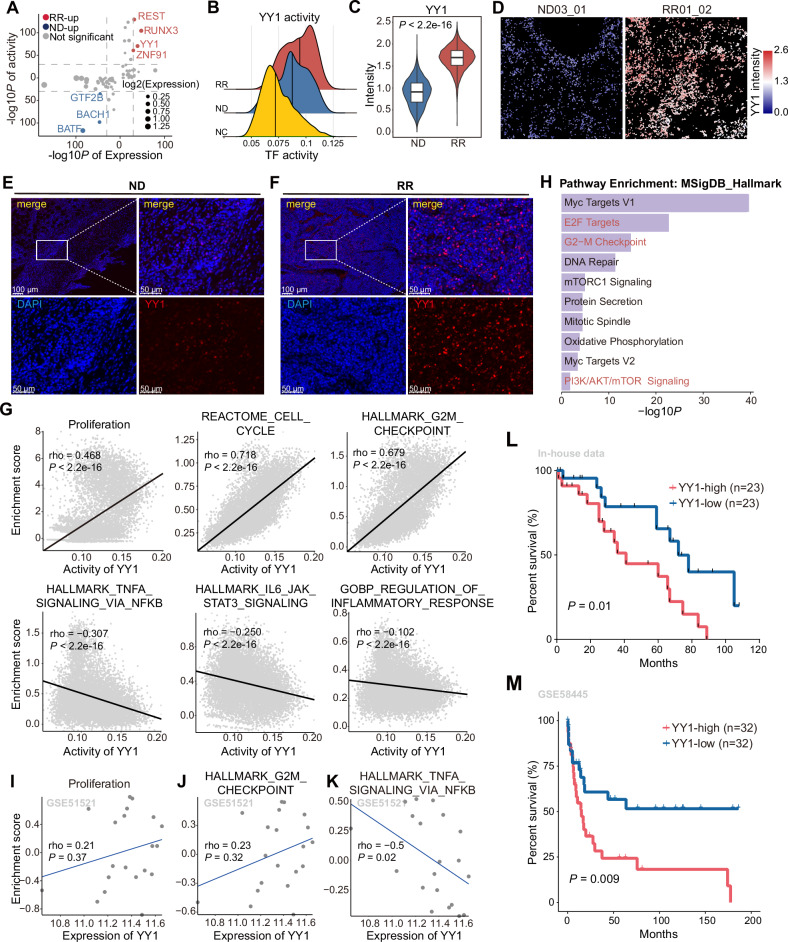
Fig. 3. The distinct transcriptional regulatory mechanisms of malignant Tfh cells in RR-AITL.
A Dot plot shows TFs that significantly activated in Tfh cells from RR-AITL compared to ND-AITL. Y axis represents -log10 transformation of adjusted P values of the activity of TFs inferred by pySCENIC, x axis represents -log10 transformation of adjusted P values of the expression of TFs. B Density plot shows the activity of YY1 across Tfh from NC (yellow), ND-AITL (blue) and RR-AITL (red). The vertical line represents the median of YY1 activity. C The intensities of YY1 between Tfh cells from ND-AITL and RR-AITL. The y axis represents the protein levels of YY1 in IMC dataset. D The protein activity of YY1 within malignant Tfh cells shown on IMC images. The colors represent protein activity levels, ranging from lower (blue) to higher (red). E, F Immunofluorescence analysis for ND-AITL (E) and RR-AITL (F) samples stained by anti-DAPI (blue) and anti-YY1(red) antibodies. Scale bar, 100 μm. G The spearman correlation between activity of YY1 and the enrichment score of pathways in malignant Tfh cells. Each data point represents an individual cell. H The functional enrichment analysis of YY1 target genes inferred by pySCENIC. The spearman correlation between YY1 expression and enrichment scores of proliferation (I), G2M checkpoint (J), TNFα signaling via NFκB (K) in GSE51521 dataset. Each data point represents individual sample. L Overall survival of AITL patients in our in-house cohort through Kaplan–Meier analysis. All patients were categorized into two groups based on the median YY1 expression level estimated by IHC. The significance was evaluated by the log-rank test. M Kaplan–Meier analysis was performed to assess overall survival in PTCL patients within the GSE58445 dataset. Only samples with available follow-up data were included in the analysis. Patients were stratified into four quartiles based on YY1 expression levels. For further comparison, the top 25% and bottom 25% of patients were specifically analyzed. The statistical significance of survival differences between these two groups was evaluated using the log-rank test.

