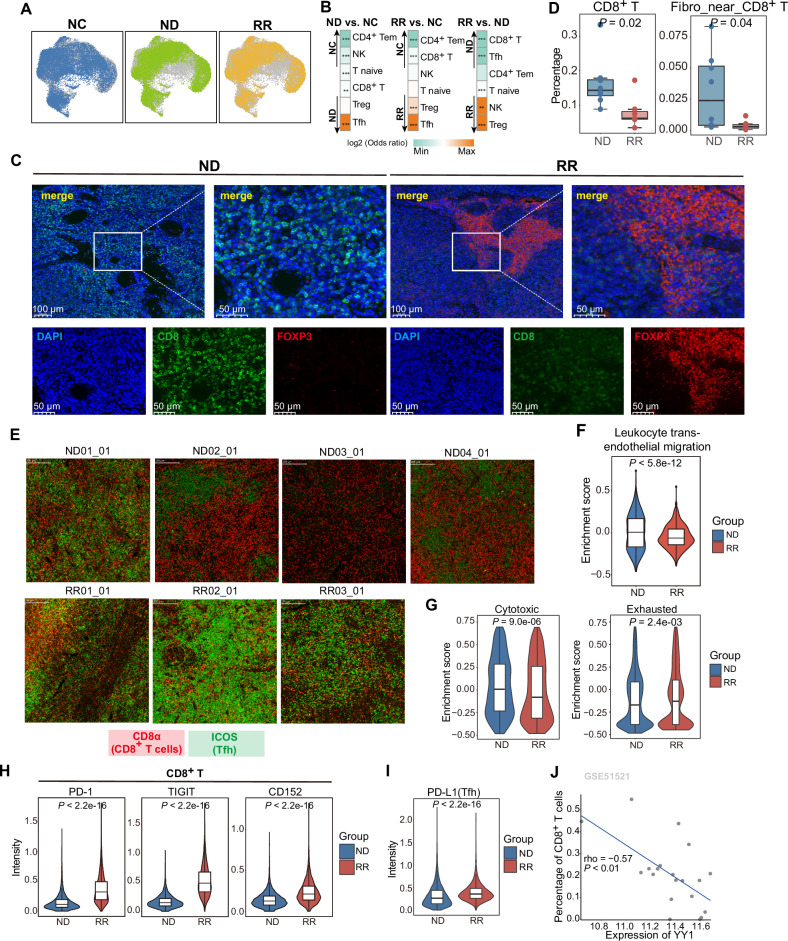
Fig. 4. The exclusion and dysfunction of CD8+ T cells in RR-AITL.
A T/NK cells from NC, ND-AITL and RR-AITL illustrated in UMAP plots, respectively. B Group preference of T cells subtypes, with color encoded by odds ratio estimated by one-sided Fisher’s exact test. *P value < 0.05, **P value < 0.01,***P value < 0.001. The orange color represents enrichment of subpopulation in the sample, while green color represents depletion of subpopulation in the sample. C Immunofluorescence analysis for ND-AITL (left) and RR-AITL (right) samples stained by anti-DAPI (blue), anti-CD8 (green), anti-FOXP3(red) antibodies. Scale bar, 100 μm. D The percentage of selected cell types within IMC dataset between ND-AITL and RR-AITL. E The representative markers for Tfh cells (ICOS; green) and CD8+ T cells (CD8α; red) stained in each ROI. F Enrichment scores of pathways related to T cell migration capacity in CD8+ T cells from ND-AITL and RR-AITL samples. P values were determined by two-sided unpaired Wilcoxon test. G Enrichment scores of cytotoxic and exhausted signatures of CD8+ T cells from ND-AITL and RR-AITL samples. ***P value < 0.001. P values were determined by two-sided unpaired Wilcoxon test. H Violin plots depict the intensities of immune checkpoint molecules in CD8+ T cells between seven and eight ROIs from RR-AITL and ND-AITL, respectively. P values were determined by two-sided unpaired Wilcoxon test. I Violin plots showing the intensities of PD-L1 in malignant Tfh cells across seven and eight ROIs in RR-AITL and ND-AITL, respectively. P values were determined by two-sided unpaired Wilcoxon test. J The spearman correlation between YY1 expression and the percentage of CD8+ T cells estimated by CIBERSORTx in GSE51521 dataset. Each data point represents individual sample.

