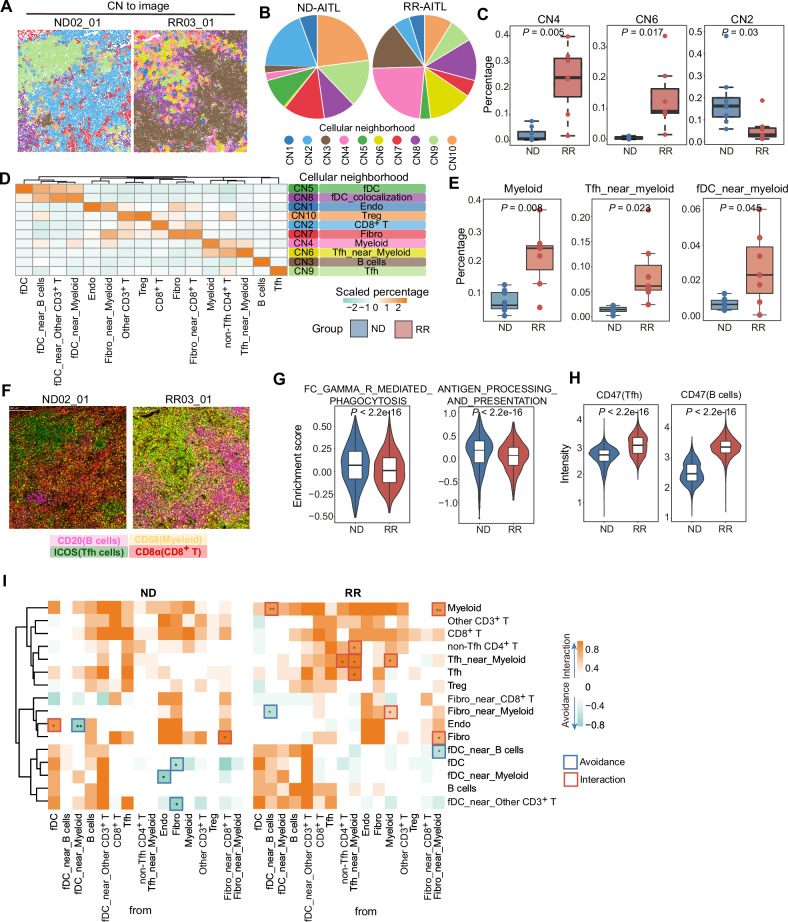
Fig. 6. The dysfunctional myeloid cells in RR-AITL.
A The CNs were depicted in the representative images from RR-AITL and ND-AITL, with colors indicating different CNs. B Pie chart showing the CNs distribution within ND-AITL and RR-AITL. C Boxplots depict the percentage of selected CNs within all cells between ROIs from ND-AITL and RR-AITL. D The heatmap illustrates the scaled percentage of cell types in each cellular neighborhood. The predominant cell type in each CN is presented in the right. E The percentage of selected cell types between ROIs from ND-AITL and RR-AITL. P values were determined by two-sided unpaired Wilcoxon test. F four markers representing B cells, Tfh cells, myeloid cells, and CD8+ T cells were visualized in the representative images. G The enrichment score of phagocytosis and antigen presentation in myeloid cells based on scRNA-seq data. H Violin plot showing the protein levels of CD47 in malignant Tfh cells and B cells. P values were determined by two-sided unpaired Wilcoxon test. I The heatmap illustrates significant pairwise cell-cell interactions (in orange) or avoidance (in green) between different cell types. Boxes highlight significant interactions (in red) or avoidance (in blue) between RR-AITL and ND-AITL. P-values were determined using a two-sided unpaired Wilcoxon test. *P values < 0.05, **P values < 0.01.

