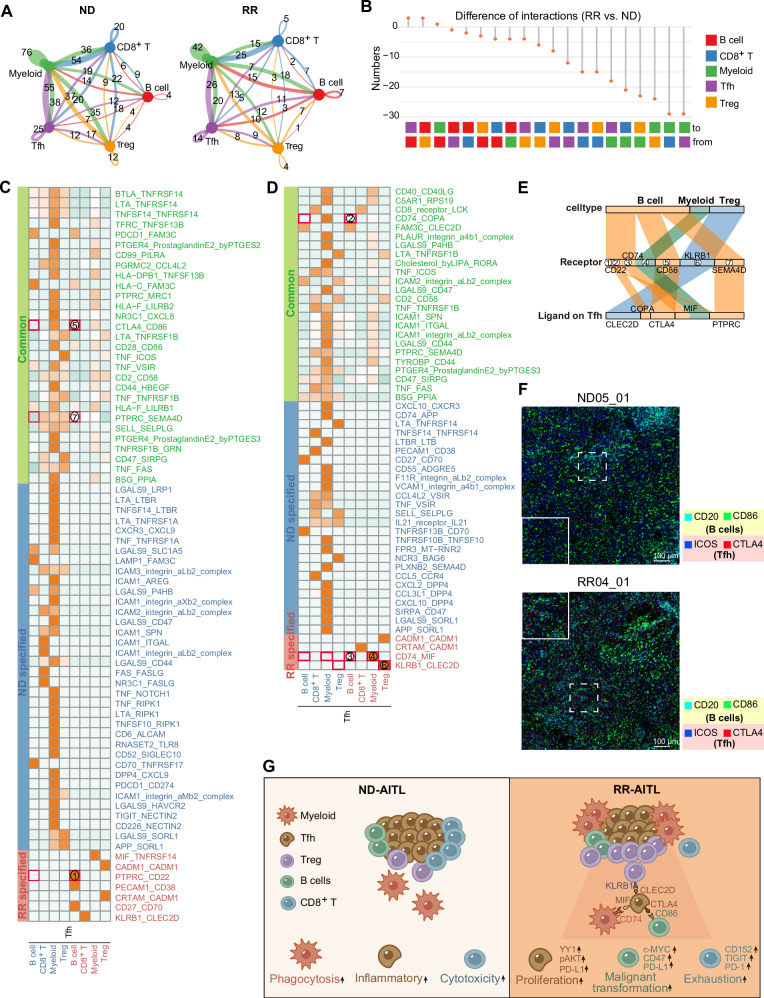
Fig. 7. The alterations of cell-cell communications in RR-AITL compared to ND-AITL.
A Circos plots showing the interaction numbers among various cell types in ND-AITL(left) and RR-AITL(right) samples. These interactions were predicted based on scRNA-seq data. B The number of significant ligand-receptor pairs between the RR-AITL and ND-AITL, as depicted in a lollipop plot. C, D Heatmap depicting the intricate ligand-receptor interactions between Tfh cells and other cell types. The ‘Common’ category (green) signifies the presence of ligand-receptor pairs in both ND-AITL and RR-AITL. The ‘ND-specified’ category (blue) and ‘RR-specified’ category (red) indicate the occurrence of ligand-receptor pairs exclusively in ND-AITL or RR-AITL, respectively. Numbers enclosed in red boxes indicate the interacting pairs displayed in Figure E. E Sankey plot illustrating the essential ligand-receptor pairs exclusive to RR-AITL, with ligands expressed on Tfh cells. The color scheme indicates different cell types expressing the receptors. F The IMC images showing the protein activity of CD20, CD86 within B cells and ICOS, CTLA4 within Tfh cells in ND-AITL and RR-AITL samples. The colors represent corresponding proteins. The solid line frame represents a magnified version of the dashed line frame. Scale bar, 100 μm. G Schematic representation of TME alterations between RR-AITL and ND-AITL.

