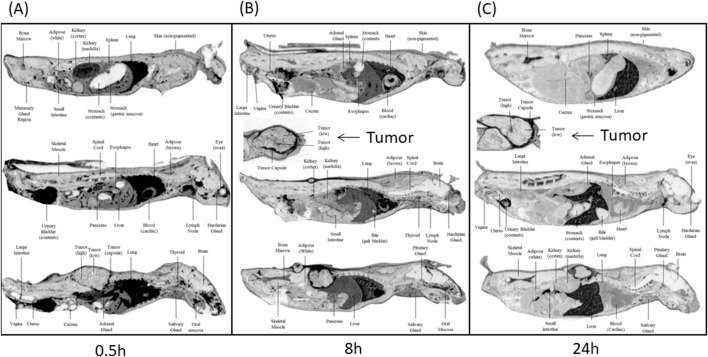
FIGURE 2.
Whole-body autoradiograms (QWBA) of selected cross-sections of tumor-bearing mice. Selected cross-section tissues were taken at different time points (A) 0.5 h, (B) 8 h, and (C) 24 h post-administration of [14C] CA102N. Darker shades in the autoradiograms represent areas with higher concentrations of radioactivity, indicating increased drug distribution. Tumor areas are marked, and comparisons of radioactivity distribution between tumor tissues and other selected organs (e.g., liver, kidneys, lungs) are shown at each time point. The images demonstrate the temporal distribution of CA102N and metabolites, highlighting initial uptake and prolonged retention in tumor tissues. h refers to hours post-dose.

