Fig. 3.
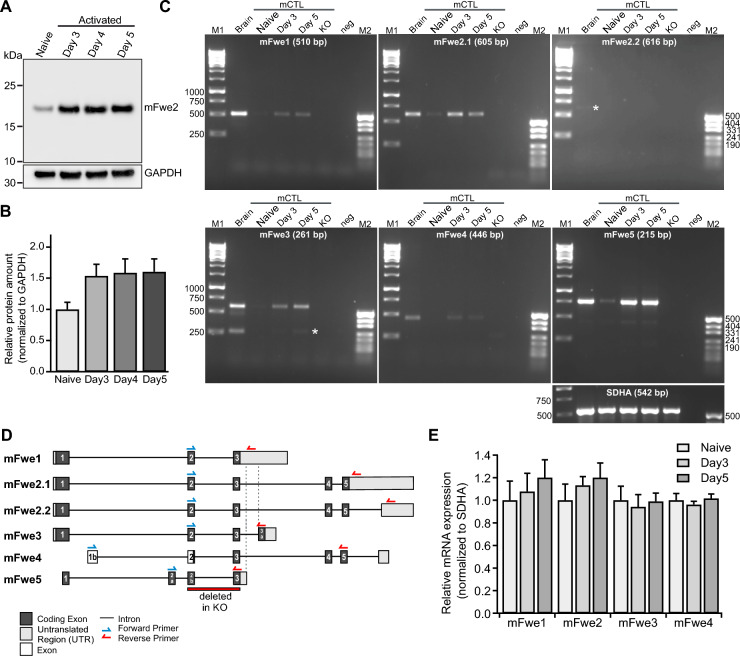
Flower expression in mouse CTL at different days of activation. A Representative western blot of Flower protein expression levels in homogenates of naive and stimulated mouse WT CTL of day 3, day 4 and day 5 (20 µg per lane). The loading control was GAPDH. B Quantitative analysis of the western blots shown in A. Flower expression was normalized to the expression level of GAPDH. The data represent means ± SEM from four mice. C RT-PCR analysis of mFwe1, mFwe2.1 and 2.2, mFwe3, mFwe4 and mFwe5 transcripts (Transcript: ENSMUST00000114004.8, ENSMUST00000114007.8, ENSMUST00000114006.8, ENSMUST00000114005.9, ENSMUST00000114003.2, ENSMUST00000133807.2, respectively) in WT mouse CTL at different activation states. Total RNA from adult mouse brains was used as the positive control, and total RNA isolated from mFwe knockout spleens was used as the negative control. White stars show the positions of the expected bands in mFwe2.2 and mFwe3. SDHA was used as the loading control. D Scheme of primer localization for RT-PCR analyses on the six postulated mouse Flower transcripts mFwe1 (ENSMUST00000114004.8), mFwe2.1 (ENSMUST00000114007.8), mFwe2.2 (ENSMUST00000114006.8), mFwe3 (ENSMUST00000114005.9), mFwe4 (ENSMUST00000114003.2) and mFwe5 (ENSMUST00000133807.2). Exon coding regions are shown in black with numbers, and putative exons are shown in white with numbers. Untranslated regions are shown in gray. The red bar shows the targeted deletion of exon 2 and exon 3 in the mFwe KO mouse. E Expression of mFwe1, mFwe2, mFwe3 and mFwe4 in naive, day 3 and day 5 CTL normalized to the expression of the SDHA as housekeeping gene. The data represent means ± SD of samples from three mice per condition

