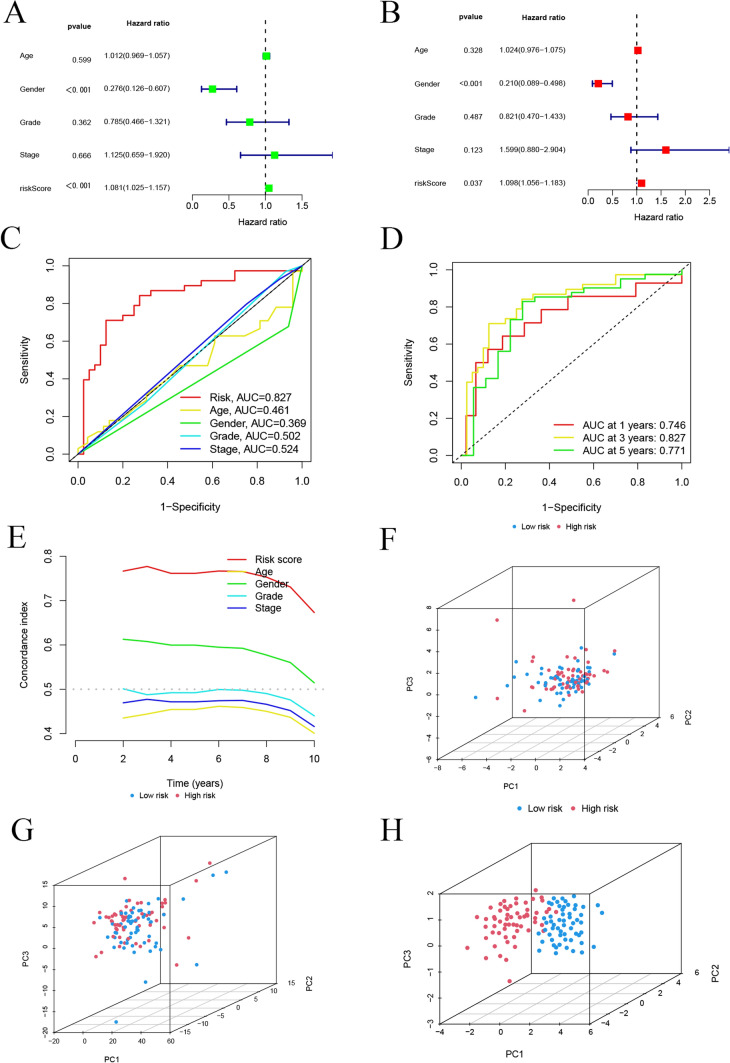
Fig. 4.
Evaluation of the Prognostic Accuracy and Independence of the Risk Model. A Forest plot of univariate Cox regression analysis. B Forest plot of multivariate Cox regression analysis. C ROC curve of clinical risk indicators and risk scores for the entire cohort. D ROC curves of the risk model predicting 1-year, 3-year, and 5-year overall survival (OS) in the entire cohort. E C-index curves for risk scores and other clinicopathological variables. F PCA of the expression of 14 mitochondria-related drug resistance genes. G PCA of the expression of 632 mitochondria-related drug resistance gene lncRNAs. H PCA of the 7 prognosis-related mitochondria-related drug resistance gene lncRNA features

