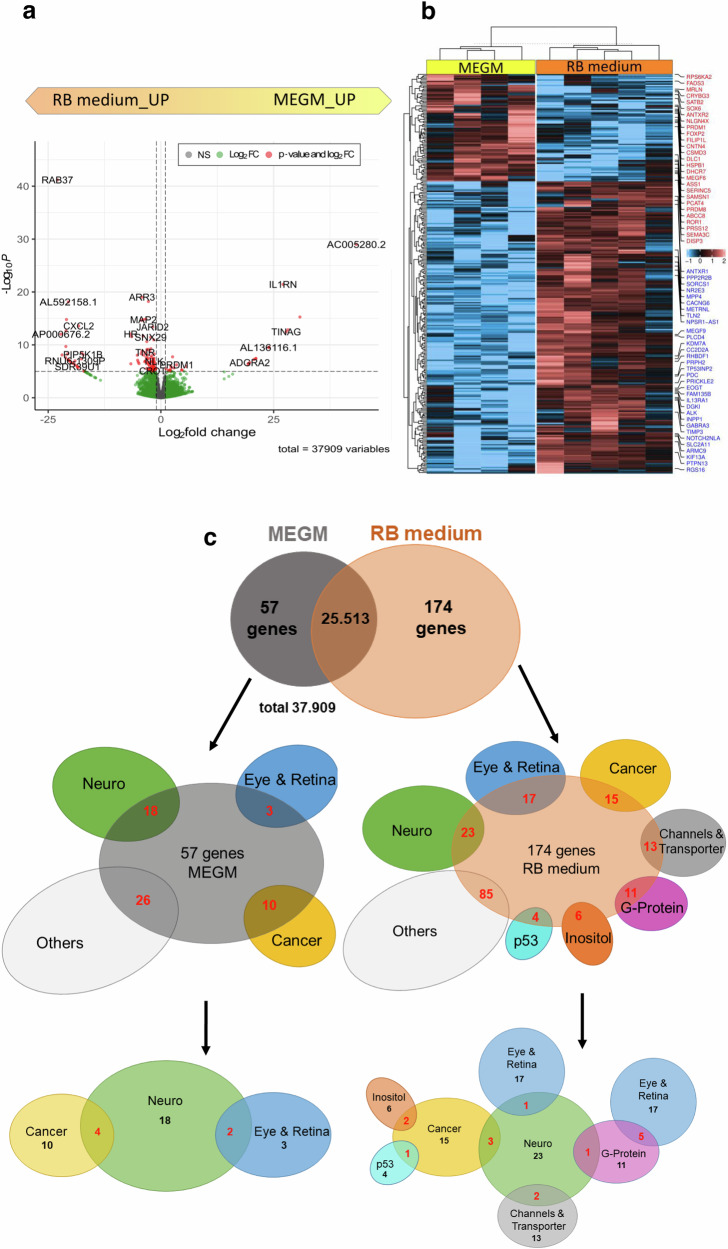
Fig. 2. RNAseq analysis of primary RB tumorspheres cultured in RB and MEGM medium.
Volcano plot (a), heatmap (b) and Venn diagram (c) of differentially expressed genes (DEGs) of primary RB tumorspheres either grown in RB or MEGM media as revealed by RNAseq analysis. a Significantly upregulated DEGs are depicted in red (P-Value > 0.05); upregulated DEGs are depicted in green (Log2 FC); non-regulated genes are depicted in grey. b Heatmap of significantly up- and down-regulated DEGs with a minimum fold change of 1.5 in all cell lines analyzed, the highlighted genes deviates in individual specimens are shown in red (MEGM group) and blue (RB group). c Venn diagram analysis of 231 DEGs identified comparing RB tumorspheres grown in MEGM or RB media. The 57 DEGs of the MEGM group and the 174 DEGs of the RB group were categorized into functional groups comprising of at least three DEGs of one RB relevant topic (red numbers in middle row of blots). The lowermost blots depict functional groups connected to each and in the overlapping areas, numbers of DEGs belonging to more than one RB relevant topic is displayed (red numbers).

