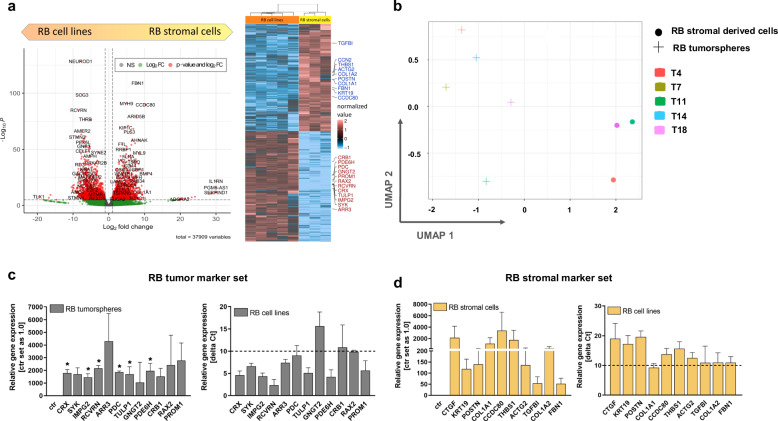
Fig. 3. Volcano plot, heatmap and UMAP analysis and endogenous expression levels of identified marker sets for RB tumorspheres and RB derived stromal cells grown in RB medium.
a Significantly upregulated DEGs are depicted in red (P-Value > 0.05); upregulated DEGs are depicted in green (Log2 FC); non-regulated genes are depicted in grey (volcano plot). Heatmap of significantly up- and down-regulated DEGs with a minimum fold change of 1.5 and highlighted genes of the “stromal marker set” in red and “RB marker set” in blue. b UMAP analysis of stroma-like RB cells (T4, T11 and T18) and RB tumorspheres (T4, 7, 11, 14 and 18) derived from five different patients displayed a clear separation of both groups. c, d Relative expression levels of genes defined as “RB marker set” in RB tumorspheres in comparison to the respective stromal cells (ctr) of the same specimen (c) and relative expression levels of genes defined as “stromal marker set” in RB derived stromal cells in comparison to the RB tumorspheres (ctr) of the same specimen (d) as revealed by real-time PCR. Expression levels of both gene marker sets were additionally analyzed by real-time PCR in four RB cells lines (Y79, WERI-Rb1, RB355 and Rbl-13; right graph in c, d). Delta Ct values are shown with a delta Ct of 10 equating a Ct value > 30, being defined as not expressed (c, d). Values are means of three independent RB tumor specimens or four independent RB cell lines ± SEM. *P < 0.05 statistical differences compared to the control group calculated by Student’s t-test.

