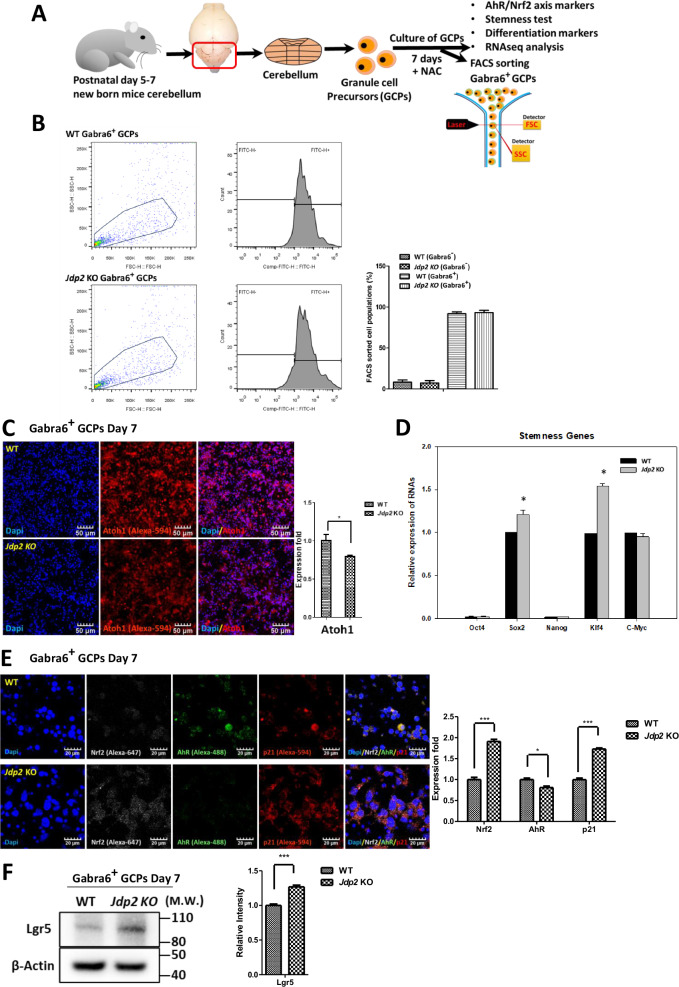
Fig. 1. Characterization of mouse Gabra6+ GCPs by fluorescence-activated cell sorting (FACS).
A Schematic model of the cultivation of mouse GCPs purified via discontinuous density gradient centrifugation from the cerebella (postnatal days 5–7) of mice [15, 16] in the presence of NAC (30 μM) for 7 days [10, 11], followed by characterization and FACS-based sorting using an anti-Gabra6 antibody. B FACS-based sorting to enrich the subfraction of Gabra6+ GCPs from WT and Jdp2KO mice. The left panel depicts a representative dot plot of FSC and SSC. The region was gated in dot plots and Gabra6+ cells were sorted by FACS analysis. The histogram was gated on a peak, to identify the percentage of GCPs that expressed Gabra6. C Staining of Gabra6+ GCPs from WT and Jdp2 KO mice with an anti-Atoh1 antibody. The nuclei of PGCs were stained with DAPI. Relative ratio of Atoh1-positive cells among Gabra6+ GCPs from WT and Jdp2 KO cells. Scale bars, 50 μm. D Relative values of the Oct4, Sox2, Nonog, Klf4, and c-Myc mRNAs between WT and Jdp2 KO Gabra6+ GCPs. The primer sequences used for qPCR are listed in Supplementary Table 2. The levels of the WT cells were taken as 1.0. E Immunostaining of Gabra6+ GCPs from WT and Jdp2 KO mice for Nrf2, p21Cip1, and AhR. The GC nuclei were stained with DAPI. The levels of the WT cells were taken as 1.0. Scale bars, 20 μm. F Comparative expression of the Lgr5 proteins, as assessed by Western blotting (left panel; the quantitation of each protein is shown on the right panel). The relative value was normalized to that of β-actin and presented as a ratio. Uncropped raw data was shown in Fig. S5. B–F: n = 5; *P < 0.05, **P < 0.01; ***P < 0.001.

